
LETTER FROM THE EDITOR
This month we are including a number of charts. As technicians, it is a relatively simple matter to generate charts. The challenge is to create meaningful charts. We think the authors of the charts in this month’s newsletter accomplished that. Each of the charts presented in this issue can be studied to develop new insights into the markets. Many members enjoy obtaining information on career opportunities. We try to include that information in the newsletter when we can and will be including more information in the next few months about the QGLDX Trading Strategy Contest. This contest has a rigid, quantified process that allows money managers to demonstrate their skill and to obtain a oneyear exclusive contract to trade at least $1 million in assets. We also have a news release from a company that has created a platform designed to help financial services firms launch new technology applications. The cost and time dedicated to software development can be daunting to professionals focused on the financial markets. New innovations in technology are creating new opportunities for professionals to expandTo view this content you must be an active member of the TAN Association.
Not a member? Join the TAN Association and unlock access to hundreds of hours of written and video technical analysis content, including the Journal of Technical Analysis and the Video Archives. Learn more about Membership here.
What's Inside...
USE RSI TO SPOT THE END OF THE CURRENT BULL MARKET
by Paul Ciana, CMTEditor’s note: Additional charts illustrating the concept explained in this article are included as an Appendix to this month’s newsletter. The Relative Strength Index, or RSI, is among the most...
REFLECTING ON THE 2014 DOW AWARD
by Charlie Bilello, CMT & Michael Gayed, CFAThough only a few months have passed, it feels a like a lifetime ago when the Market Technicians Association honored us with the 2014 Charles H. Dow Award for our paper titled “An Intermarket...
POPULAR INDICATORS ON THOMSON REUTERS EIKON
by Cornelius LucaEditor’s note: This was originally published by Thompson Reuters and is reprinted here with permission. Knowing which indicators are widely used can help traders understand why prices react in...
THE BULL MARKET WANTS TO GO HIGHER. BUT HOW MUCH FUEL IS LEFT FOR A POST-LABOUR DAY ADVANCE?
by Ron MeiselsOne month ago the markets looked weak and the bulls duly retreated in what we forecasted to be “an overdue and probably modest correction” in the first week of August. We said in our last Market...
INTERVIEW WITH CHRISTOPHER DIODATO, CMT
by Christopher Diodato, CMT, CFA | 2019 Charles H. Dow Award Winner & Amber Hestla-BarnhartHow would you describe your job? Currently, I am a fee-only, ETF-only, financial advisor with Morgan Stanley Wealth Management. I try to simplify the investment management process using my ETF-only...
BLOOMBERG BRIEF DEMONSTRATES HOW TO PROGRAM RELATIVE HIGHS AND LOWS IN ANY SOFTWARE
by Eoghan LeahyIn the August 21 issue of Bloomberg Brief Technical Strategies, a simple technique for programming relative highs and lows was explained. Relative highs and lows can help individual traders identify...
SEVEN REASONS AN ANALYST’S CALL TRACKER AND A TRADER’S LEDGER NEVER MATCH
by Apurva Sheth, CMTOver the past 4 years I have been analyst providing trading ideas to institutional and retail clients. Over that time, I’ve come to realize my call sheet and their ledger would not always agree....
MTA CHAPTER REPORT: HONG KONG
by Jackson Zhu, CFA, CMT, ACCA, FRMAssuming the leadership role 2012, I quickly realized that we were working with a relatively small member base in Hong Kong. From the very beginning I have been focusing on two main...
ETNA TRADER INTRODUCES DISRUPTIVE FINTECH TECHNOLOGY
by Roman ZrazhevskiyETNA, a trading platform provider traditionally catering to broker-dealers, announced today that it is partnering with FinTech startups as well as established financial services firms looking to...
CHART OF THE MONTH FROM THOMSON REUTERS EIKON
The following Ichimoku Cloud charts of major market indexes are provided by Thomson Reuters Eikon. Dow Jones Industrial Average DailyDow Jones Industrial Average WeeklyRussell 2000 Index DailyRussell...
APPENDIX: CHARTS OF RSI STREAKS IN BULL MARKETS
The weekly charts below of the Dow Jones Industrial have all been provided by Bloomberg LP. November 2012 to PresentApril 1997 to August 1998December 1994 to July 1996October 1992 to March...
USE RSI TO SPOT THE END OF THE CURRENT BULL MARKET
Editor’s note: Additional charts illustrating the concept explained in this article are included as an Appendix to this month’s newsletter.
The Relative Strength Index, or RSI, is among the most popular indicators selected on Bloomberg and is commonly used as an oscillator to time overbought and oversold markets. It can also be used as an indicator of future market weakness. You may be thinking of divergence analysis, rather this article will discuss a different and unique application of the indicator as it relates to the continuous positive momentum in the S&P500.
Before turning to the rules for interpreting RSI as a trend forecasting tool it is important to remember that indicators don’t have to provide information all of the time to be useful. Infrequent but highly reliable signals could be more valuable than frequent signals with a low rate of success. This analysis of RSI provides infrequent signals that have had a
To view this content you must be an active member of the TAN Association.
Not a member? Join the TAN Association and unlock access to hundreds of hours of written and video technical analysis content, including the Journal of Technical Analysis and the Video Archives. Learn more about Membership here.
Contributor(s)

Paul Ciana, CMT
Paul Ciana, is Bank of America's Chief Global FICC Technical Strategist and Director of Research. Paul believes the best technical strategy is a diversified technical strategy, so he aligns proprietary and familiar technical theory to make the best call. He publishes his views...
REFLECTING ON THE 2014 DOW AWARD
Though only a few months have passed, it feels a like a lifetime ago when the Market Technicians Association honored us with the 2014 Charles H. Dow Award for our paper titled “An Intermarket Approach to Beta Rotation.” One of our goals in writing the paper was to further bridge the gap between technical analysis and institutional money management. Without question the MTA and Dow Award have been instrumental in achieving this goal.
In the paper, we revealed a Beta Rotation Strategy (BRS) that uses the relative strength of Utilities to the market as an indicator to rotate into either the lower beta Utilities sector or the higher beta broad market. The behavior of the Utilities sector is one component of our ATAC rotation strategies used to manage our own mutual funds and separate accounts. We documented how a Beta Rotation Strategy would have achieved consistent outperformance on an absolute and
To view this content you must be an active member of the TAN Association.
Not a member? Join the TAN Association and unlock access to hundreds of hours of written and video technical analysis content, including the Journal of Technical Analysis and the Video Archives. Learn more about Membership here.
Contributor(s)

Charlie Bilello, CMT
Charlie Bilello, who holds the Chartered Market Technician (CMT) designation, is the Director of Research at Pension Partners, LLC, where he is responsible for strategy development, investment research and communicating the firm’s investment themes and portfolio positioning to...

Michael Gayed, CFA
Michael A. Gayed is Portfolio Manager at Toroso Investments, an investment management company specializing in ETF focused research, investment strategies and services designed for financial advisors, RIAs, family offices and investment managers. Prior to Toroso Investments,...
POPULAR INDICATORS ON THOMSON REUTERS EIKON
Editor’s note: This was originally published by Thompson Reuters and is reprinted here with permission. Knowing which indicators are widely used can help traders understand why prices react in certain ways.
Technically inclined traders gauge markets with either trend tools or various analyses. They are looking for insight on the strength or weakness of the ongoing trend and on possible beginning of a new trend. This letter focuses on the most popular technical analyses. These analyses should be used in conjunction with trend tools, such as trend line and various Fibonacci ration analyses.
The seven most popular analyses are:
- Moving averages
- Bollinger Bands
- Stochastics
- Moving Averages Convergence Divergence (MACD)
- Relative Strength Index (RSI)
- Ichimoku Kinko Hyo
- Rate of Change
MOVING AVERAGES
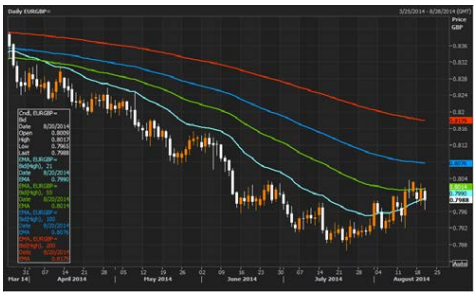
The chart above shows euro/sterling (EURGBP=) with four exponential moving averages drawn on it: 21-day (light blue), 55-day (green), 100-day
To view this content you must be an active member of the TAN Association.
Not a member? Join the TAN Association and unlock access to hundreds of hours of written and video technical analysis content, including the Journal of Technical Analysis and the Video Archives. Learn more about Membership here.
Contributor(s)

Cornelius Luca
Corelius Luca authored “Trading in the Global Currencies Markets,” published by Prentice Hall (3rd edition – 2007), a comprehensive analysis of the foreign exchange markets, instruments, players and methods of forecasting, and “Technical Analysis Applications in the...
THE BULL MARKET WANTS TO GO HIGHER. BUT HOW MUCH FUEL IS LEFT FOR A POST-LABOUR DAY ADVANCE?
One month ago the markets looked weak and the bulls duly retreated in what we forecasted to be “an overdue and probably modest correction” in the first week of August. We said in our last Market Comment that the 1,900 area for the S&P 500 would prove to be a battleground for the bulls and bears and that proved to be the case. The major market indices spent most of the rest of August moving back up towards previous highs and, except for the DJI, making new bull market highs.
Given the technical weakness that emerged during mid-summer, the August pull back was surprisingly short and shallow. The S&P 500 showed “trading support” in the 3-5% range, similar to the ones that have occurred over the past 18 months. It now appears that the “cycle cluster” of the short-term 105-day cycle and the long-term 39 week cycle matured a couple of
To view this content you must be an active member of the TAN Association.
Not a member? Join the TAN Association and unlock access to hundreds of hours of written and video technical analysis content, including the Journal of Technical Analysis and the Video Archives. Learn more about Membership here.
Contributor(s)

Ron Meisels
Ron Meisels is Founder and President of Phases & Cycles Inc. with over 50 years of stock market experience. He specializes in the independent research of Canadian and U.S. securities and market using Behavior Analysis. Institutions ranked him among the top...
INTERVIEW WITH CHRISTOPHER DIODATO, CMT
How would you describe your job?
Currently, I am a fee-only, ETF-only, financial advisor with Morgan Stanley Wealth Management. I try to simplify the investment management process using my ETF-only models and give my clients active portfolio management at a lower cost than one would find from many other advisors.
What led you to look at the particular markets you specialize in?
My concentration of study within the technical analysis field, especially while working at Lowry Research, was Supply & Demand. My top-down, mostly quantitative approach relies heavily on market breadth analysis, and to really analyze breadth, you need a large universe of “things” to properly create and/or use an indicator. Naturally, that drew me to equities, since there are so many different broad universes to choose from (domestic market indexes, sector indexes, and international market indexes). My current project, which has been largely successful thus far, is to apply my quantitative methodology
To view this content you must be an active member of the TAN Association.
Not a member? Join the TAN Association and unlock access to hundreds of hours of written and video technical analysis content, including the Journal of Technical Analysis and the Video Archives. Learn more about Membership here.
Contributor(s)

Christopher Diodato, CMT, CFA | 2019 Charles H. Dow Award Winner
Chris Diodato became a student of technical analysis at a young age, enrolling in the TAN Program during his freshman year of college. Since then, he attained his CMT and CFA charters and worked in various research and portfolio management roles. Currently, Chris is the Senior...

Amber Hestla-Barnhart
BLOOMBERG BRIEF DEMONSTRATES HOW TO PROGRAM RELATIVE HIGHS AND LOWS IN ANY SOFTWARE
In the August 21 issue of Bloomberg Brief Technical Strategies, a simple technique for programming relative highs and lows was explained. Relative highs and lows can help individual traders identify stocks or ETFs with unusual strength or price action that is diverging from the broader trend. This is a form of relative strength analysis and in effect provides a way to highlight relative strength on charts without the need to calculate a more complex version of the indicator.
In Programming Signals to Identify 52-Week Relative Highs and Lows, Eoghan Leahy, CMT, MSTA, wrote:
Relative strength analysis is popular among equity market participants as a way to identify the outperformance or underperformance of a stock relative to its benchmark index. If the share price of Apple is up 2 percent on a day when the S&P 500 is up 1 percent, then the relative outperformance of Apple is 1 percent. This
To view this content you must be an active member of the TAN Association.
Not a member? Join the TAN Association and unlock access to hundreds of hours of written and video technical analysis content, including the Journal of Technical Analysis and the Video Archives. Learn more about Membership here.
Contributor(s)
Eoghan Leahy
Eoghan Leahy, who holds a Chartered Market Technician (CMT) designation, is a Market Specialist for Bloomberg covering Technical Analysis, Cryptocurrency and Quant Strategy Development. Eoghan works primarily with professional institutional clients across asset classes and...
SEVEN REASONS AN ANALYST’S CALL TRACKER AND A TRADER’S LEDGER NEVER MATCH
Over the past 4 years I have been analyst providing trading ideas to institutional and retail clients. Over that time, I’ve come to realize my call sheet and their ledger would not always agree. Rather than debating my performance, let’s hit the nail on the head and tackle the main problem:
Why does a trader who trades based on the calls of an analyst have a huge variation in his profit figure (if there is a profit) when compared to the ‘paper’ profit figure shown in the analyst’s call sheet?
To understand the answer to this problem, we need to first understand the roles of each of these market participants.
A trader is anyone who tries to buy low and sell higher or takes short positions by selling high and buying to cover after a price decline. A trader’s holding perspective can be anything from a few minutes to a couple
To view this content you must be an active member of the TAN Association.
Not a member? Join the TAN Association and unlock access to hundreds of hours of written and video technical analysis content, including the Journal of Technical Analysis and the Video Archives. Learn more about Membership here.
Contributor(s)

Apurva Sheth, CMT
Apurva Sheth, CMT, has been working with the Institution Research Desk of JHP Securities Pvt. Ltd (India) for the last four years as a Technical Analyst. He can be reached at
MTA CHAPTER REPORT: HONG KONG
Assuming the leadership role 2012, I quickly realized that we were working with a relatively small member base in Hong Kong. From the very beginning I have been focusing on two main initiatives
- grow the community
- provide deep connections
Looking back at our activities these past two years, I can see several things that influenced our current success. We organized a series of seminars, each attracted more than 100 attendees. Spread out over the two years, we invited a stellar line-up of speakers, such as Larry Williams, David Keller, and John Logan. These seminars were great opportunities to bring in non-members, attract positive attention to our discipline and collaborate with other local societies.

This August, I called together the first of many smaller format meetings. Participants came in with various backgrounds – Director of
To view this content you must be an active member of the TAN Association.
Not a member? Join the TAN Association and unlock access to hundreds of hours of written and video technical analysis content, including the Journal of Technical Analysis and the Video Archives. Learn more about Membership here.
Contributor(s)

Jackson Zhu, CFA, CMT, ACCA, FRM
Mr. Zaiqing 'Jackson' Zhu, CFA, CMT, ACCA, FRM is a Desktop Developer at Bloomberg in Hong Kong. A self-taught programmer, Jackson builds and delivers VBA solutions to the Bloomberg community for research and trading purposes. Jackson was formerly a Bloomberg Technical Analysis...
ETNA TRADER INTRODUCES DISRUPTIVE FINTECH TECHNOLOGY
ETNA, a trading platform provider traditionally catering to broker-dealers, announced today that it is partnering with FinTech startups as well as established financial services firms looking to launch new software. Having noticed an up-tick in development costs over recent years as consumer expectations grow, ETNA’s goal is to lower the buy-in for new and established FinTech firms looking to create new technologies. Their platform has already facilitated the successful launch of FinTech startups Tradier and ETRE Financial, and is now being offered to a broader market.
“We encourage entrepreneurs to create new technology products and services without the need to take out a second mortgage or sell a kidney” commented Roman Zhukov, CEO at ETNA. “Many of the components that go into FinTech are very similar. There is no need to reinvent the wheel and spend millions of dollars when someone has already done it and is willing to share the
To view this content you must be an active member of the TAN Association.
Not a member? Join the TAN Association and unlock access to hundreds of hours of written and video technical analysis content, including the Journal of Technical Analysis and the Video Archives. Learn more about Membership here.
Contributor(s)
Roman Zrazhevskiy
CHART OF THE MONTH FROM THOMSON REUTERS EIKON
The following Ichimoku Cloud charts of major market indexes are provided by Thomson Reuters Eikon.
Dow Jones Industrial Average Daily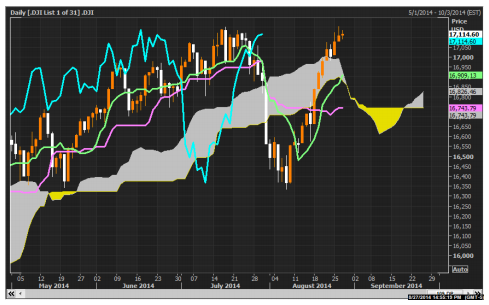 Dow Jones Industrial Average Weekly
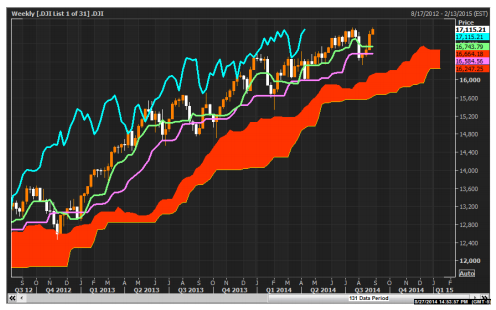 Russell 2000 Index Daily
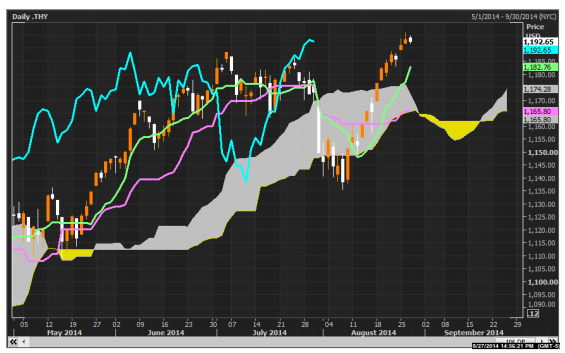 Russell 2000 Index Weekly
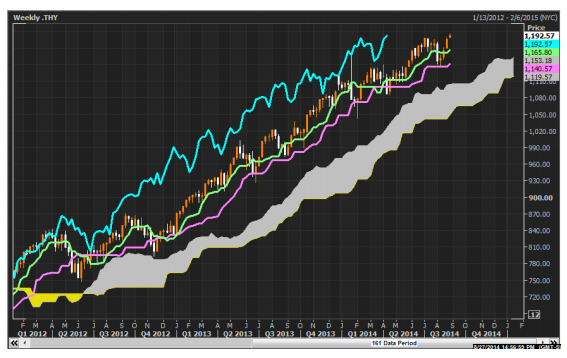
For more information about Eikon, contact Cornelius Luca at cornelius.luca@thomsonreuters.com.
To view this content you must be an active member of the TAN Association.
Not a member? Join the TAN Association and unlock access to hundreds of hours of written and video technical analysis content, including the Journal of Technical Analysis and the Video Archives. Learn more about Membership here.
APPENDIX: CHARTS OF RSI STREAKS IN BULL MARKETS
The weekly charts below of the Dow Jones Industrial have all been provided by Bloomberg LP.
November 2012 to Present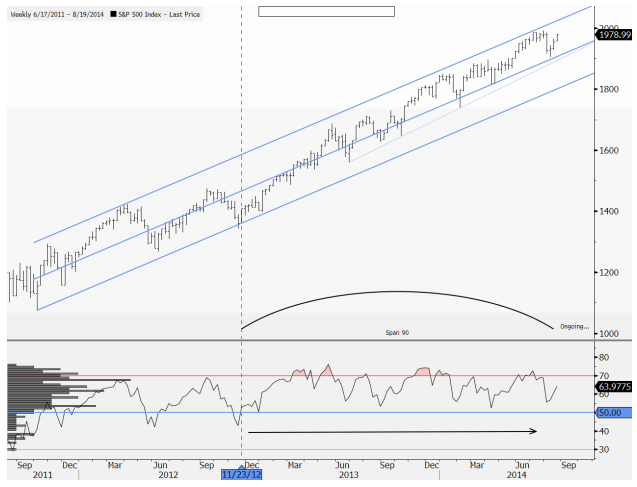 April 1997 to August 1998
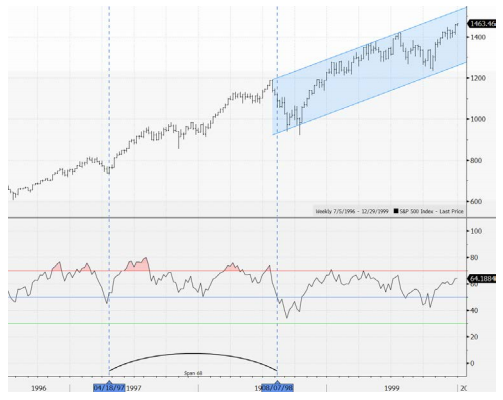 December 1994 to July 1996
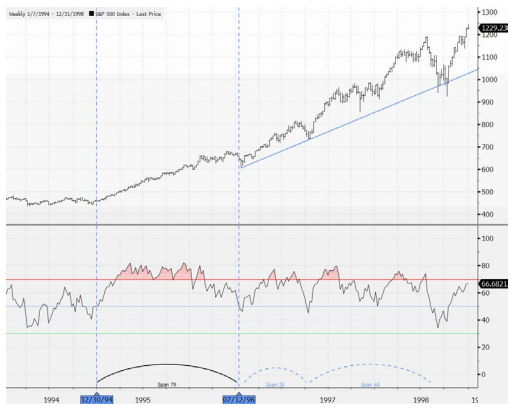 October 1992 to March 1994
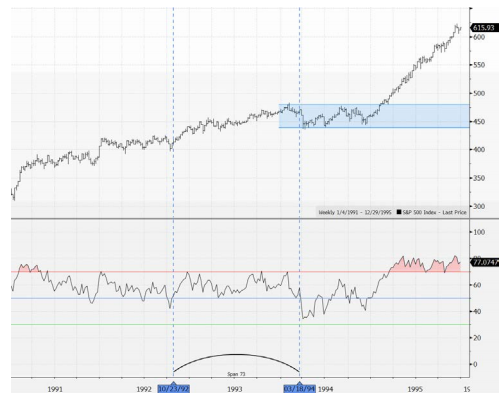 November 1963 to June 1965
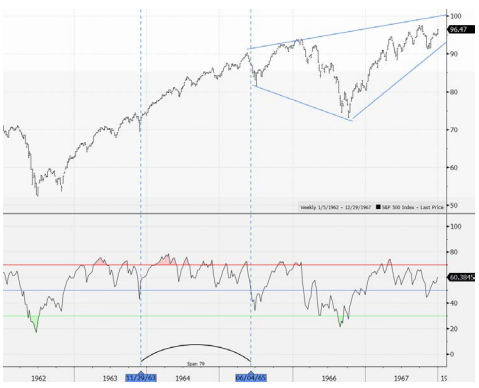 April 1958 to September 1959
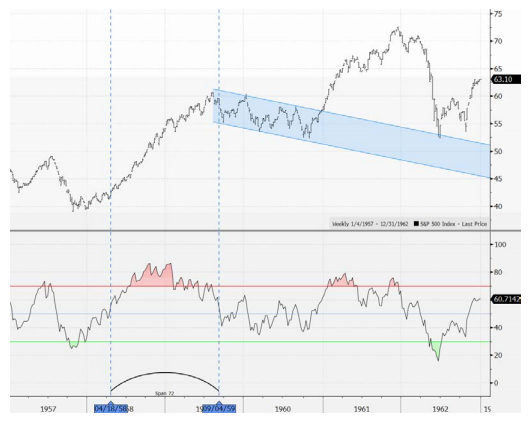
To view this content you must be an active member of the TAN Association.
Not a member? Join the TAN Association and unlock access to hundreds of hours of written and video technical analysis content, including the Journal of Technical Analysis and the Video Archives. Learn more about Membership here.
New Educational Content This Month
-
August 26, 2020

The CMT Experience
Presenter(s): Tyler Wood, Dave Lundgren, CMT, CFA
-
August 26, 2020
Reading the Current Market in Light of History’s Lessons
Presenter(s): Ryan Detrick, CMT
-
August 12, 2020

How to Spot Major Trend Reversals with Elliott Waves and Socionomics: Examples from Asia’s Ongoing Secular Bull Market
Presenter(s): Mark Galasiewski