
LETTER FROM THE EDITOR
Scott Hathaway leads off this month’s issue with another example of how he uses geometry to identify market patterns. Scott has contributed to several issues of Technically Speaking and readers seem to be interested in his work. As always, Scott delivers enough detail to reproduce his techniques.
Content in the rest of the issue reflects Scott’s philosophy of innovation and detail. We are getting an updated view of the metals market from Jordan Roy-Byrne, CMT. Jordan frequently publishes his forecasts and his thought process can be seen in reading his commentaries. We then reprint a couple of MTA Blog posts. This may be an overlooked member benefit but blogs found on MyMTA are often excellent research pieces. Scott frequently posts updates there and his latest insights in gold can be
found there.
Educational webcasts are also a benefit of MTA membership and two recent presentations are summarized. John Kosar, CMT, and Larry Connors are two very creative, data-driven technicians. Although different in many ways, their work shares an attention to history and detail
To view this content you must be an active member of the TAN Association.
Not a member? Join the TAN Association and unlock access to hundreds of hours of written and video technical analysis content, including the Journal of Technical Analysis and the Video Archives. Learn more about Membership here.
What's Inside...
GEOMETRY CORNER: A STEP-BY-STEP LOOK AT THE S&P 500’S UPTREND USING THE PREVIOUS UPTREND
by Scott Hathaway, CFTeIt never ceases to amaze me how price movement is so intricately related to itself. Here, I would like to present one of my own geometric approaches (Relative Charting) in a step-by-step procedure...
NEW CYCLICAL BULL UNDERWAY IN GOLD STOCKS
by Jordan Roy-Byrne, CMTEditor’s note: We have previously featured Jordan Roy-Byrne’s opinions on the precious metals markets in this newsletter. With the recent breakout in gold, we wanted to offer an update of his...
MTA BLOGS
by Robert F. Palmerton, Jr., CMT & Keith Richards CMT, CIM, FCSIEditor’s note: MTA members can maintain blogs under the MyMTA section of the MTA web site. The length and detail provided in the blogs varies but offer valuable information. Two short blog posts...
US FINANCIAL UPDATE FOR SEPT. 2012
by John Kosar, CMTThis is a summary of a webcast presentation by John Kosar, CMT on August 22nd, 2012 as part of the MTA’s Educational Web Series. The complete presentation can be found at...
INTERVIEW WITH MANUEL AMUNATEGUI, CMT
by Manuel Amunategui & Amber Hestla-BarnhartHow would you describe your job? I currently own a software consulting firm but still find time to trade. I became interested in the markets while working at Microsoft in the late nineties and have...
A QUANTIFIED AND SYSTEMATIC WAY TO TRADE LEVERAGED ETFS
by Laurence ConnorsThis is a summary of a webcast presentation by Larry Connors on August 8, 2012 as part of the MTA’s Educational Web Series. The complete presentation can be found at...
MTAEF AWARDS SECOND CMT SCHOLARSHIP TO TANNER MOORE
The MTA Educational Foundation (MTAEF) awarded its second CMT Scholarship in late August to Tanner Moore, a senior at the University of Arkansas. Tanner is in the honors program at the Sam M. Walton...
GEOMETRY CORNER: A STEP-BY-STEP LOOK AT THE S&P 500’S UPTREND USING THE PREVIOUS UPTREND
It never ceases to amaze me how price movement is so intricately related to itself. Here, I would like to present one of my own geometric approaches (Relative Charting) in a step-by-step procedure which outlines the S&P 500’s rather steadfast up trend since the major low of 666.79 on the week of Mar 2, 2009, as well as ties together the last 18 years. These perspectives will be offered from the previous large uptrend from the major low of 768.63 on the week of Oct 7, 2002 to the all-time high of 1576.09 on the week of Oct 8, 2007. (Notice the 60 month cycle which repeats this October.)
STEP 1: Calculate the Vector Ratio
Every trend can be mathematically quantified by its exact low and high. In this case, the market moved 807.46 points (from 768.63 to 1576.09) over a period of 261 weeks. This is an average movement of 3.0937
To view this content you must be an active member of the TAN Association.
Not a member? Join the TAN Association and unlock access to hundreds of hours of written and video technical analysis content, including the Journal of Technical Analysis and the Video Archives. Learn more about Membership here.
Contributor(s)

Scott Hathaway, CFTe
Scott Hathaway, CFTe is the Co-Founder and Manager of Pattern to Profit, LLC, a new independent technical investment research firm utilizing unique geometric analysis of global markets. A musician by trade, Scott committed to the constant study, exploration and...
NEW CYCLICAL BULL UNDERWAY IN GOLD STOCKS
Editor’s note: We have previously featured Jordan Roy-Byrne’s opinions on the precious metals markets in this newsletter. With the recent breakout in gold, we wanted to offer an update of his opinions. This article was previously published on August 27 at http://go.mta.org/581
Three weeks ago we wrote that the short-term outlook in precious metals was bullish. Quoting our conclusion: “The bottom line is this sector is very close to a breakout which would likely confirm the May bottom. The price action has started to improve and the sector has not been deterred by the aforementioned bad news which, in normal conditions would have caused a selloff. In the meantime, the public has been bearish the entire year and the dumb money has started to exit the market. It is this combination of factors that lead us to a firm bullish posture over the rest of the summer.” In terms of weekly
To view this content you must be an active member of the TAN Association.
Not a member? Join the TAN Association and unlock access to hundreds of hours of written and video technical analysis content, including the Journal of Technical Analysis and the Video Archives. Learn more about Membership here.
Contributor(s)

Jordan Roy-Byrne, CMT
Jordan Roy-Byrne, CMT, is the editor of The Daily Gold Premium, a service began in July 2009. The model portfolio gained 57.0% in the last six months of 2009 and gained 86.5% in 2010. As of June 6, 2011 the portfolio was up 10.5% year to date while GDXJ (junior gold stocks) was...
MTA BLOGS
Editor’s note: MTA members can maintain blogs under the MyMTA section of the MTA web site. The length and detail provided in the blogs varies but offer valuable information. Two short blog posts are shown below, offering an example of the high quality work found under the blog section of MyMTA.
Discretionaries Outperform Staples: Is The Risky Trade Returning?
by Robert Palmerton Jr., CMT
Staples and other conservative, higher-yielding stocks have outperformed the broader market since May. The chart below shows the S&P500 as the horizontal black line, with Staples (orange) and discretionaries (purple) either outperforming or underperforming the S&P500 (depending on whether the orange or purple line is above or below the black S&P500 line).
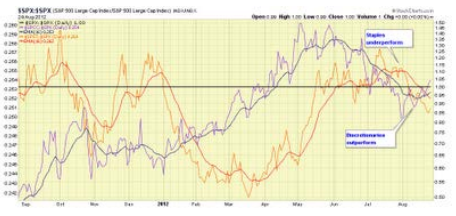
Discretionaries peaked in April and have underperformed vs. Staples until recently. Staples peaked in mid-July. In mid-August, we
To view this content you must be an active member of the TAN Association.
Not a member? Join the TAN Association and unlock access to hundreds of hours of written and video technical analysis content, including the Journal of Technical Analysis and the Video Archives. Learn more about Membership here.
Contributor(s)

Robert F. Palmerton, Jr., CMT
Robert F. Palmerton, Jr., CMT, has over 25 years’ experience in corporate finance. He has held positions as CFO, Director of Finance, and Financial Management and Analysis roles for Fortune 500 and multi-national firms (ADP, Honeywell, BOC Group) as well as for early-stage and...

Keith Richards CMT, CIM, FCSI
Keith Richards is President & Chief Portfolio Manager of ValueTrend Wealth Management Inc. Keith has been in the securities industry since 1990 and is a highly regarded member of the small, exclusive community of Chartered Market Technicians in Canada. Keith’s...
US FINANCIAL UPDATE FOR SEPT. 2012
This is a summary of a webcast presentation by John Kosar, CMT on August 22nd, 2012 as part of the MTA’s Educational Web Series. The complete presentation can be found at http://go.mta.org/578.
John Kosar is a well-known technical analyst and is particularly well-known for providing specific and actionable trading ideas. John uses a variety of data and has developed unique insights into the data. In this presentation, he shared some of his tools.
John began by noting that the US stock market has managed to grind higher during the past month (to mid-August) despite an ever-growing list of technical headwinds including extremes in investor sentiment, volatility, put vs. call volume, and market breadth.
Most analysts look at AAII surveys or Investors Intelligence data to gain an insight into sentiment. Investor sentiment analysis shows how John uses data many other analysts fail to consider. Smaller, actively managed RIAs have reached a most bullish extreme
To view this content you must be an active member of the TAN Association.
Not a member? Join the TAN Association and unlock access to hundreds of hours of written and video technical analysis content, including the Journal of Technical Analysis and the Video Archives. Learn more about Membership here.
Contributor(s)

John Kosar, CMT
John Kosar, CMT, is the Chief Market Strategist of Asbury Research LLC, a firm he launched in 2005. Asbury Research provides a blend of technical and quantitative investment research to both institutional and private investors. In addition, John is also the Chief Investment...
INTERVIEW WITH MANUEL AMUNATEGUI, CMT
How would you describe your job?
I currently own a software consulting firm but still find time to trade. I became interested in the markets while working at Microsoft in the late nineties and have stayed involved with them in one form or another. I have traded full-time in the past and have built software for Wall Street firms in the market making and proprietary trading arenas.
What led you to look at the markets you currently trade instead of another tradable?
I have traded options and futures, but as of late, mostly ETFs and in particular the SPYDERs. I love its stability, liquidity and low cost. I do not use any fundamentals, except in avoiding the markets during announcements and important reports. Due to a busy schedule, I don’t trade much on a discretionary basis anymore, but instead through automated systems. I think getting an automated trading/testing platform, where one can try
To view this content you must be an active member of the TAN Association.
Not a member? Join the TAN Association and unlock access to hundreds of hours of written and video technical analysis content, including the Journal of Technical Analysis and the Video Archives. Learn more about Membership here.
Contributor(s)

Manuel Amunategui
Manuel Amunategui has worked on Wall Street in the options industry for over six years. He now lives in Portland, Oregon and spends most of his time in the data and data-mining industry but still finds time to experiment and run trading systems. He can be reached at...
Amber Hestla-Barnhart
A QUANTIFIED AND SYSTEMATIC WAY TO TRADE LEVERAGED ETFS
This is a summary of a webcast presentation by Larry Connors on August 8, 2012 as part of the MTA’s Educational Web Series. The complete presentation can be found at http://go.mta.org/579.
Larry Connors is an expert in developing trading strategies and is the author of a number of books and papers that detail his research. He focuses on what works in the markets rather than theories about how markets should work and delivers complete systems that any trader can apply. This presentation offered insight into some of his latest work.
Larry began by noting, “Of the many investment instruments we have run studies on, Leveraged ETFs tend to have amongst the historically highest directional predictability. The reasons for this are likely due to the fact that most Leveraged ETFs are made up of equity baskets.
Equity baskets tend to move from overbought and oversold on a short-term basis. The fact that Leveraged ETFs
To view this content you must be an active member of the TAN Association.
Not a member? Join the TAN Association and unlock access to hundreds of hours of written and video technical analysis content, including the Journal of Technical Analysis and the Video Archives. Learn more about Membership here.
Contributor(s)

Laurence Connors
Laurence Connors is Chairman of The Connors Group (TCG), and the principal executive officer of Connors Research LLC. TCG is a financial markets information company that publishes daily commentary and insight concerning the financial markets and has twice...
MTAEF AWARDS SECOND CMT SCHOLARSHIP TO TANNER MOORE
 The MTA Educational Foundation (MTAEF) awarded its second CMT Scholarship in late August to Tanner Moore, a senior at the University of Arkansas. Tanner is in the honors program at the Sam M. Walton College of Business at U of A. In the past year he had an internship at a foreign exchange brokerage firm and was involved as an aerospace analyst with the student-run Rebsamen Trust. After graduation in May 2012 Tanner plans to begin a career path in investment banking.
The MTAEF has had a long and successful relationship with the Walton College of Business and the Garrison Financial Institute, which is organized within the Sam M. Walton College of Business to advance financial education and knowledge through practice. Together with these organizations, the MTAEF is able to support the teaching of technical analysis on campus. The Foundation addresses a select
To view this content you must be an active member of the TAN Association.
Not a member? Join the TAN Association and unlock access to hundreds of hours of written and video technical analysis content, including the Journal of Technical Analysis and the Video Archives. Learn more about Membership here.
New Educational Content This Month
-
August 26, 2020

The CMT Experience
Presenter(s): Tyler Wood, Dave Lundgren, CMT, CFA
-
August 26, 2020
Reading the Current Market in Light of History’s Lessons
Presenter(s): Ryan Detrick, CMT
-
August 12, 2020

How to Spot Major Trend Reversals with Elliott Waves and Socionomics: Examples from Asia’s Ongoing Secular Bull Market
Presenter(s): Mark Galasiewski