
LETTER FROM THE EDITOR
We have a variety of articles for you to consider this month. We start with a look back. Many of us forget that trading software is relatively new and in the first article, one of the pioneers in the development of trading software, Louis Mendelsohn, provides insights into the evolution of software and technical analysis. We are also reprinting some of Lou’s work from the 1990’s which detail problems the financial industry still faces today. We then look at volatility using articles that rely more on the common VIX indicator including the thoughts of three Federal Reserve economists. Other articles provide insights into the state of the markets and work being done by MTA members and chapters around the world. MTA member, Stella Osoba, CMT, published “Women on Wall Street” on Traders Planet. The article provides valuable career advice for both individuals breaking into the field and those in established positions. The article highlights ten valuable career tips for those seeking a job or for those looking to advance within their current position. You can read the whole articleTo view this content you must be an active member of the TAN Association.
Not a member? Join the TAN Association and unlock access to hundreds of hours of written and video technical analysis content, including the Journal of Technical Analysis and the Video Archives. Learn more about Membership here.
What's Inside...
THE EVOLUTION OF TECHNICAL ANALYSIS: THE CATALYZING FORCE
by Brandon JonesEvolution is about change… adaption… survival. For a thing to evolve, though, it needs a catalyst – an environmental shift of a substantial magnitude or a subtle mutation – that...
BROADENING THE SCOPE OF TECHNICAL ANALYSIS: THE IMPORTANCE OF AN INTERMARKET PERSPECTIVE
by Louis B. MendelsohnEditor’s note: this was originally published in the March 2001 issue of Technically Speaking. With the proliferation of microcomputers and trading software over the past two decades, there has been...
VOLATILITY IN PERSPECTIVE
by Ed EasterlingEditor’s note: This was originally published by Crestmont Research (www.CrestmontResearch.com) and is reprinted with permission. Who or what is rocking the boat? Is the current level of volatility...
WHAT CAN WE LEARN FROM PRIOR PERIODS OF LOW VOLATILITY
by Fernando Duarte & Juan Navarro-Staicos & Carlo RosaEditor’s note: This was originally posted at the New York Federal Reserve’s Liberty Street Economics, a site that “features insight and analysis from economists working at the intersection of...
CONTRARY OPINION FORUM
by Susan BergerEditor’s note: Susan recently attended the Contrary Opinion Forum, an annual meeting sponsored by Fraser Advisors that “centers around the idea of learning to think for yourself in solving...
SUMMARY OF MTA SINGAPORE CHAPTER MEETING
by Jamie Coutts, CMT, CFTeThe MTA Singapore Chapter Meeting was honored to host Alex Siew, Dr Sun, and Caner Seren Varol, CMT, CFA, ERP at the September 30th, 2014. There were over 110 market professionals and investors who...
INTERVIEW WITH GREGORY HARMON, CMT, CFA
by Greg Harmon, CMT & Amber Hestla-BarnhartHow would you describe your job? I don’t know that I really have a job in the sense that many see it. I have two small businesses that require an awful lot of my time. It is more a lifestyle...
SUMMARY OF THE CHICAGO MTA CHAPTER EVENT
by Brian Stoner, CMT, CFARalph Acampora is an excellent lecturer and it was no surprise that he drew a large crowd to the Chicago chapter meeting last month. He gave us a rich perspective of what Wall Street was like 40...
REMEMBERING 1995 DOW AWARD WINNER WILLIAM X. SCHEINMAN
William X. Scheinman received the Charles H. Dow Award in 1995 for his paper, Information, Time and Risk. In his paper, William outlined the core principals of Dow Theory and concepts by Edson H....
U.S. SECTOR ETF PORTFOLIO
by Jonathan BeckEditor’s note: This was originally published on September 29, 2014 at WWW.JBECKINVESTMENTS.COM and is reprinted with permission. ETF selection has been based upon a traditional approach to ETF...
WINANS LEGACY STOCK INDEX (WILSI)
by Ken Winans, CMTThe Winans Legacy Stock Index (WILSI) is an unweighted composite of approximately 110 common stocks (from diverse industry sectors) that have been continuously traded on the New York Stock Exchange...
CHART OF THE MONTH
Other Winans Indexes include the Winans Real Estate Index™ (WIREI) and the Winans Preferred Stock Index® (WIPSI). The data is available through Global Financial Data, Metastock or Stockcharts. The...
THE EVOLUTION OF TECHNICAL ANALYSIS: THE CATALYZING FORCE
Evolution is about change… adaption… survival. For a thing to evolve, though, it needs a catalyst – an environmental shift of a substantial magnitude or a subtle mutation – that forces change to occur.
In the late 1970s, the magnitude of the newly introduced personal computer (PC) caused an environmental shift that forced change upon the world. Adapt or perish was the new reality for everyone. In the financial sector, this reality was equally true, except that a not-so-subtle mutation in technical analysis made adapting even more imperative. If those who traded markets did not adapt, they perished.
Recently, a number of trading publications have featured articles highlighting the evolution of technical analysis since the advent of personal computers nearly forty years ago. As history tells us, technical analysis evolved dramatically with the introduction of PC-based trading software and then again later as the global economy emerged and the world’s financial markets
To view this content you must be an active member of the TAN Association.
Not a member? Join the TAN Association and unlock access to hundreds of hours of written and video technical analysis content, including the Journal of Technical Analysis and the Video Archives. Learn more about Membership here.
Contributor(s)

Brandon Jones
Brandon Jones is an active trader and writer. He has worked with Lou Mendelsohn’s innovations for many
BROADENING THE SCOPE OF TECHNICAL ANALYSIS: THE IMPORTANCE OF AN INTERMARKET PERSPECTIVE
Editor’s note: this was originally published in the March 2001 issue of Technically Speaking.
With the proliferation of microcomputers and trading software over the past two decades, there has been a surge of interest by futures and equities traders in applying technical analysis to their trading decisions. Concurrently, a transformation has been underway, due in part to advancements in global telecommunications and information technologies, in which the financial markets have become increasingly globally interconnected and interdependent.
Despite the globalization of the financial markets, technical analysis is still directed primarily at analyzing each individual market by itself. This is done utilizing various technical indicators, many of which have undergone little, if any, change in their construction since first being applied by technicians decades ago. These include subjective charting analysis techniques such as head and shoulders, flags, pennants, and triangles, which attempt to find repetitive patterns in singlemarket data thought to be useful for
To view this content you must be an active member of the TAN Association.
Not a member? Join the TAN Association and unlock access to hundreds of hours of written and video technical analysis content, including the Journal of Technical Analysis and the Video Archives. Learn more about Membership here.
Contributor(s)
Louis B. Mendelsohn
VOLATILITY IN PERSPECTIVE
Editor’s note: This was originally published by Crestmont Research (www.CrestmontResearch.com) and is reprinted with permission.
Who or what is rocking the boat? Is the current level of volatility “normal” or is it extreme in either direction? The purpose of this presentation is to graphically put volatility into historical perspective. This report will be updated periodically as volatility is just too volatile to be ignored.
The first look at volatility uses the common measure of standard deviation. For this analysis, the monthly percentage changes in the S&P 500 Index are used and then the result is annualized to reflect a measure of the amount of variability in the market. This measure is often used by financial market professionals as an indication or measure of risk in models that assess risk versus return. It’s not important for this discussion to go into detail about the statistic—it is only necessary to appreciate that it is
To view this content you must be an active member of the TAN Association.
Not a member? Join the TAN Association and unlock access to hundreds of hours of written and video technical analysis content, including the Journal of Technical Analysis and the Video Archives. Learn more about Membership here.
Contributor(s)
Ed Easterling
Ed Easterling is the author of Probable Outcomes: Secular Stock Market Insights and the award-winning Unexpected Returns: Understanding Secular Stock Market Cycles. He is currently president of an investment management and research firm. In addition, he previously served as an...
WHAT CAN WE LEARN FROM PRIOR PERIODS OF LOW VOLATILITY
Editor’s note: This was originally posted at the New York Federal Reserve’s Liberty Street Economics, a site that “features insight and analysis from economists working at the intersection of research and Fed policymaking.”
Volatility, a measure of how much financial markets are fluctuating, has been near its record low in many asset classes. Over the last few decades, there have been only two other periods of similarly low volatility: in May 2013, and prior to the financial crisis in 2007. Is there anything we can learn from the recent period of low volatility versus what occurred slightly more than one year ago and seven years ago? Probably; the current volatility environment appears quite similar to the one in May 2013, but it’s substantially different from what happened prior to the financial crisis.
For the three periods we consider, the chart below compares how low volatilities are across the following asset classes: two-year
To view this content you must be an active member of the TAN Association.
Not a member? Join the TAN Association and unlock access to hundreds of hours of written and video technical analysis content, including the Journal of Technical Analysis and the Video Archives. Learn more about Membership here.
Contributor(s)
Fernando Duarte
Fernando Duarte is an economist in the Federal Reserve Bank of New York’s Research and Statistics
Juan Navarro-Staicos
Juan Navarro-Staicos is a financial markets analyst in the Bank’s Markets
Carlo Rosa
Carlo Rosa is an economist in the Bank’s Markets
CONTRARY OPINION FORUM
Editor’s note: Susan recently attended the Contrary Opinion Forum, an annual meeting sponsored by Fraser Advisors that “centers around the idea of learning to think for yourself in solving practical investment problems.”
It was a small but quality crowd. Some spouses come, but typically do not stay past one presentation, and look for something else to do. Alas, their partners are clued to the overhead charts with a passion that is cruelty to most people. The presenters were either very bullish or very bearish, and closely split. I highlighted on a few situations that I found interesting.
A few bearish charts and thoughts that gave me pause and I looked at them more closely:
- One commented that there are enough black swans out there to blacken the sky.
- Margin Debt on the NYSE
- The Russell 2000 leads the market down
- One commented that there are enough black swans out there to blacken the sky.
- Margin Debt on
To view this content you must be an active member of the TAN Association.
Not a member? Join the TAN Association and unlock access to hundreds of hours of written and video technical analysis content, including the Journal of Technical Analysis and the Video Archives. Learn more about Membership here.
Contributor(s)

Susan Berger
Susan Berger worked with John Magee from 1968 until his retirement and then worked as a technical analyst at Fidelity Investments. She now provides independent research and additional information can be found at
SUMMARY OF MTA SINGAPORE CHAPTER MEETING
The MTA Singapore Chapter Meeting was honored to host Alex Siew, Dr Sun, and Caner Seren Varol, CMT, CFA, ERP at the September 30th, 2014. There were over 110 market professionals and investors who attended the presentation making it a great success for this young and growing chapter.

Jamie Coutts, CMT, CFTe is the incoming Singapore Chapter Chair, taking over for newly elected MTA board member, James Brodie, CMT. Jamie opened the event with a welcome address that introduced the MTA and provided a brief overview of the CMT
Program. The guest speakers then took the floor covering a diverse range of investment topics.
Alex Siew, Fund Manager at VCB Capital presented “Detecting Reversal Points Using Traditional Indicators, Quantitative Tools and How to Systemize Your Process.” Dr Sun’s presentation was titled “Quantitative Approaches to
To view this content you must be an active member of the TAN Association.
Not a member? Join the TAN Association and unlock access to hundreds of hours of written and video technical analysis content, including the Journal of Technical Analysis and the Video Archives. Learn more about Membership here.
Contributor(s)

Jamie Coutts, CMT, CFTe
Jamie Coutts, CMT, CFTe is a Market Specialist for Buyside Equity at Bloomberg LP with experience in investment advisory, equity sales, buy and sell side trading roles. For the past 5 years at Bloomberg, Jamie has developed a proven track record in delivering enterprise...
INTERVIEW WITH GREGORY HARMON, CMT, CFA
How would you describe your job?
I don’t know that I really have a job in the sense that many see it. I have two small businesses that require an awful lot of my time. It is more a lifestyle then a job. I am a Partner and CIO at Presidium Capital, a firm where, with my two other partners, we manage separate accounts for clients. The second is Dragonfly Capital which is a subscription newsletter service with macro technical analysis and detailed trade ideas, for those that still want to do it themselves. The work that goes into both overlaps a lot but each also has its distinct features. I spend a lot of time after dinner answering subscriber questions for instance, while on the management side there are a host of other issues. So I guess I am a trader, an analyst, a teacher and a manager,
If that were
To view this content you must be an active member of the TAN Association.
Not a member? Join the TAN Association and unlock access to hundreds of hours of written and video technical analysis content, including the Journal of Technical Analysis and the Video Archives. Learn more about Membership here.
Contributor(s)

Greg Harmon, CMT
Gregory W. Harmon, who holds a Chartered Market Technician (CMT) designation, is the President and Founder of Dragonfly Capital Management, LLC, a company that provides daily technical analysis of securities markets and consulting services to the marketplace. Greg was previously...
Amber Hestla-Barnhart
SUMMARY OF THE CHICAGO MTA CHAPTER EVENT
Ralph Acampora is an excellent lecturer and it was no surprise that he drew a large crowd to the Chicago chapter meeting last month. He gave us a rich perspective of what Wall Street was like 40 years ago, how he and a close friend and colleague cofounded the Market Technician Association, and most importantly the need of serious recognition for Technical Analysis or, as they were referred to back then, “chartists”. Ralph gave the audience a vibrant perspective of the history on the development of the MTA and TAN designation. He highlighted key events, important dates, and how the TAN Program became recognized as the premier designation for technical analysts worldwide.
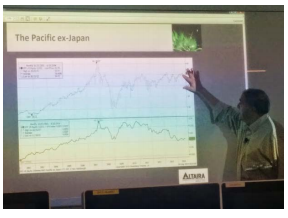
Ralph then went on to share a presentation he will be giving in Kuwait later this month for Altaira Ltd, where he serves as the Director of Technical Analysis. The
To view this content you must be an active member of the TAN Association.
Not a member? Join the TAN Association and unlock access to hundreds of hours of written and video technical analysis content, including the Journal of Technical Analysis and the Video Archives. Learn more about Membership here.
Contributor(s)
Brian Stoner, CMT, CFA
Brian Stoner, who holds a Chartered Market Technician (CMT) designation, is a futures account broker at NinjaTrader Group, LLC. Brian started his career in the financial industry as a stockbroker in the mid 90’s and spent the better part of twelve years in that industry...
REMEMBERING 1995 DOW AWARD WINNER WILLIAM X. SCHEINMAN
William X. Scheinman received the Charles H. Dow Award in 1995 for his paper, Information, Time and Risk. In his paper, William outlined the core principals of Dow Theory and concepts by Edson H. Gould, and applied the ideas to the market. Dow Theory was combined with Gould’s resistance lines, unit measurement and the rule of three. His Dow Award winning paper provides detail on each of these techniques.
William started his career on Wall Street in the mid 60’s. He learned to invest by reading works from prominent Wall Street figures and eventually became a licensed as a broker. He worked at Furman Selz Mager Dietz & Birney and then Arthur Wiesenberger & Company as a technical research analyst. He started a newsletter called Timings for institutional investors and published it until his death. He was one of the first members of the Market Technicians Association when it was founded
To view this content you must be an active member of the TAN Association.
Not a member? Join the TAN Association and unlock access to hundreds of hours of written and video technical analysis content, including the Journal of Technical Analysis and the Video Archives. Learn more about Membership here.
U.S. SECTOR ETF PORTFOLIO
Editor’s note: This was originally published on September 29, 2014 at WWW.JBECKINVESTMENTS.COM and is reprinted with permission.
ETF selection has been based upon a traditional approach to ETF research to incorporate the best suited benchmark domestic sector ETFs in a portfolio designed to outperform the overall US equities market. The analysis therein uses a classical technical approach to uncover trends, patterns, relative strength leaders, et al., in order to reveal the leading/lagging US equity sectors.
This unique dual approach to ETF research not only seeks to outperform but also to managed risk in your U.S. equity portfolio, while staying invested in a very challenging market.
Our methodology
A rigorous ranking methodology was used to select among broad based benchmark US sector ETFs. For the purposes of this asset allocation portfolio, ETFs tracking a strategy index methodology designed to “beat the market” or “become a market” were excluded from our selection process. Only
To view this content you must be an active member of the TAN Association.
Not a member? Join the TAN Association and unlock access to hundreds of hours of written and video technical analysis content, including the Journal of Technical Analysis and the Video Archives. Learn more about Membership here.
Contributor(s)
Jonathan Beck
Jonathan Beck brings over 10 years of buy/sell-side equity research experience to the table at J. Beck investments. He has previously spent more than half of his career working exclusively as a technical analyst on one of the most well respected technical analysis teams on Wall...
WINANS LEGACY STOCK INDEX (WILSI)
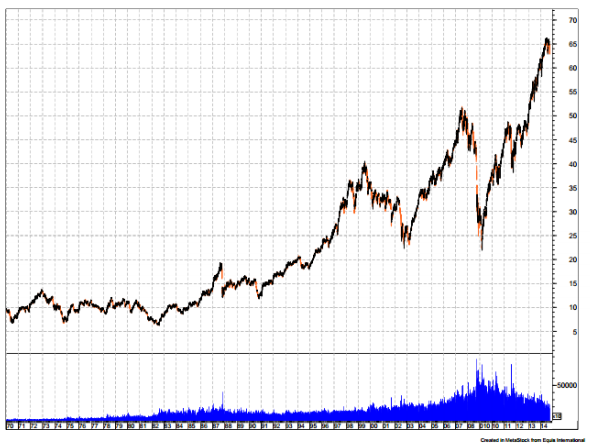 The Winans Legacy Stock Index (WILSI) is an unweighted composite of approximately 110 common stocks (from diverse industry sectors) that have been continuously traded on the New York Stock Exchange (NYSE) since 1970 and in continuous operation since 1897 (on average). Since the WILSI’s underlying components remain unchanged over the last 44 years, this provides a baseline to compare today’s market conditions to past market cycles using the exact same securities. The WILSI provides an alternative means to evaluating stock market activity (past and present), and it eliminates many of the statistical flaws inherent in conventional stock market indices (i.e., S&P 500 Index & Dow Jones Industrial Average) due to frequent changes in underlying components and data weighting methods.
Applications: The WILSI provides certain unique advantages.
- Focuses on Core Stock Investments, WILSI
To view this content you must be an active member of the TAN Association.
Not a member? Join the TAN Association and unlock access to hundreds of hours of written and video technical analysis content, including the Journal of Technical Analysis and the Video Archives. Learn more about Membership here.
Contributor(s)

Ken Winans, CMT
Ken Winans, CMT President & Founder, Winans Investments For 28 years, Ken Winans, CMT, has conducted groundbreaking financial research within the discipline of technical analysis while serving as a portfolio manager, investment analyst, broker and investor. Ken is the...
CHART OF THE MONTH
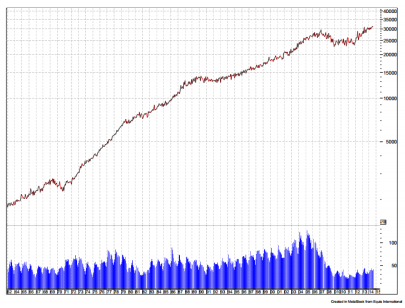
Other Winans Indexes include the Winans Real Estate Index™ (WIREI) and the Winans Preferred Stock Index® (WIPSI). The data is available through Global Financial Data, Metastock or Stockcharts.
The WIREI (Patent Pending 11/670,914) tracks new U.S. home prices since 1830. It’s unique approach rescaled and combined several well know government studies of U.S. new home prices into a continuous data set without the “gapping” and time lag problems found in other studies. The WIREI has several sub-indices: 1. Sales since 1962, 2. Inflation since 1932, 3. Home sizes (i.e., average square feet) since 1973 and 4. Geographic regions (Northeast, Midwest, South, West) since 1975. The WIREI is shown on the left.
The WIPSI was the first modern index to track these cornerstone securities. It is an evenweighted index that consists of 85
To view this content you must be an active member of the TAN Association.
Not a member? Join the TAN Association and unlock access to hundreds of hours of written and video technical analysis content, including the Journal of Technical Analysis and the Video Archives. Learn more about Membership here.
New Educational Content This Month
-
August 26, 2020

The CMT Experience
Presenter(s): Tyler Wood, Dave Lundgren, CMT, CFA
-
August 26, 2020
Reading the Current Market in Light of History’s Lessons
Presenter(s): Ryan Detrick, CMT
-
August 12, 2020
How to Spot Major Trend Reversals with Elliott Waves and Socionomics: Examples from Asia’s Ongoing Secular Bull Market
Presenter(s): Mark Galasiewski