
LETTER FROM THE EDITOR
Ethics is the lead story in this month’s magazine. The MTA is adopting a large body of knowledge related to all areas of finance through a licensing agreement with the CFA Institute. All finance professionals, whether they analyze fundamental, quantitative or technical data, share common goals (finding profitable opportunities) and share a common operating environment. Given all of the commonalities, it’s not surprising we share the same ethical requirements. This new body of knowledge will not require members of the MTA to change anything they do professionally. The original MTA Code of Ethics was comprehensive and covered all of the important standards of professional behavior. The shortcoming was a lack of case studies and examples of how to apply the Code. This licensing agreement makes all of the CFAI’s Code and Standards developed over several decades available to MTA members. For TAN candidates, this licensing agreement provides clear readings which will make studying for the exam a more efficient process. In short, there are no changes required of MTA members to meet the requirements of the new Code and Standards.To view this content you must be an active member of the TAN Association.
Not a member? Join the TAN Association and unlock access to hundreds of hours of written and video technical analysis content, including the Journal of Technical Analysis and the Video Archives. Learn more about Membership here.
What's Inside...
ETHICS
by Craig W. Johnson, CMT, CFAA Code of Ethics is one of the minimum requirements of a profession. Since its founding in 1974, MTA members have been required to adhere to a comprehensive Code of Ethics. The Code consists of a...
CMT TEST TO INCLUDE NEW ETHICS STUDY MATERIAL - WITH SAMPLE ETHICS QUESTIONS
One of the advantages of the MTA’s licensing agreement with the CFA Institute is the ability to provide detailed study material for the CMT exam. Clear examples for all parts of the Code and...
IN MEMORIAM: JIM BIRMINGHAM
Long-time MTA member James G. Birmingham passed away on April 18, 2015 at the age of 84. Jim has been a member of the MTA since 1974. Two of the defining characteristics of Jim’s life were his...
9 MISTAKES QUANTS MAKE THAT CAUSE BACKTESTS TO LIE
by Tucker Balch, Ph.D.Editor’s note: Tucker Balch was one of the presenters at the 2014 Annual Symposium. That presentation can be viewed in the Symposium archives. This was originally posted at The Augmented Trader...
THIRTY TOMORROWS BY MILTON ERZATI
by Michael Carr, CMT & Milton EzratiEditor’s note: Milton Erzati was one of the presenters at the recent Annual Symposium. His presentation included some of the information in his book which is reviewed here. Thirty Tomorrows starts...
20 YEARS PUBLISHING THIS NEWSLETTER
by Tom McClellanEditor’s note: longevity is rare in the investment newsletter business. It’s certainly not unheard of but it is rare. Tom McClellan has been publishing The McClellan Market Report for 20 years...
AI, MACHINE LEARNING, DATA MINING, AND BIG DATA- HOW DO THEY APPLY TO TRADING?
by Justin CahoonEditor’s note: this was originally posted at Inovancetech.com and is reprinted her with permission. Inovancetech is offering the free use of an algorithmic trading platform to MTA...
CANADIAN DOLLAR OUTLOOK BRIGHTENS, CHAMELEON OSCILLATOR SUGGESTS
by Alex ColeEditor’s note: The Chameleon Oscillator was detailed in the April 23 issue of Bloomberg Brief: Technical Strategies. This article is an extract of that article. In Bloomberg Brief: Technical...
KASE ON TECHNICAL ANALYSIS + ONLINE VIDEO COURSE
by Cynthia A. Kase, CMT, MFTA & Michael Carr, CMTWe all learn the basics of technical analysts differently. Some of us read the classics and think about how those ideas still apply to the current markets. Some of us find mentors who explain the...
MAPPING THE ACTIVE STRATEGY UNIVERSE
by Dave WaltonEditor’s note: this article was originally published in Proactive Advisor Magazine and is reprinted here with permission. A view into how professional strategists might classify active...
21ST CENTURY POINT AND FIGURE BY JEREMY DU PLESSIS, CMT, FSTA
by Jeremy du Plessis, CMT, FSTA & Michael Carr, CMTPoint and Figure (P&F) is one of the oldest tools of technical analysis. It’s been used since at least the 1880s yet the technique works just as well today as it did 130 years ago. The basics...
MICKEY MANTLE STRIKES OUT, THEN HITS A HOMER
by Dr. Bryan TaylorA previous blog discussed Wilt Chamberlain’s unsuccessful attempt at following up on his successful basketball career with a successful IPO. Wilt Chamberlain wasn’t the only sports star to go...
ETF SECTOR ROTATION
by Cesar AlvarezEditor’s note: This was recently published at Alvarez Quant Trading and is reprinted here with permission. A spreadsheet with the complete results of this strategy is available at the web site. My...
A "SHEER MISERY" MARKET DEFINED
by Dave MoenningEditor’s note: this article was originally published by the National Association of Active Investment Managers and is reprinted here with permission. I was recently named Chief Investment Officer...
THE MARKETS CONTINUE TO CONSOLIDATE THE BULLS SHOULD WIN THE BATTLE IN THE SECOND QUARTER
by Ron MeiselsEditor’s note: this was published in late-April and is presented as an example of long-term technical analysis. Two weeks ago our Market Comment summarized the big picture for the 2009-2015 bull...
SELL IN MAY AND GO AWAY?
by David PieperEditor’s note: This was published by Intalus at their educational blog. The code for implementing this strategy in Tradesignal is available by clicking here. HOW TO PROFIT FROM SEASONAL...
TECHNICAL ANALYSIS IN ACADEMIA
by Michael Carr, CMTTechnical analysis has been used by traders for centuries. But it has only been taught as a for-credit course at universities since 1996. In that year, the MTA Educational Foundation partnered with...
CHART OF THE MONTH: THE VIX FIX
by Amber Hestla-BarnhartIn this year’s Charles H. Dow Award paper, I described how the VIX Fix indicator could be applied as a trading strategy. The VIX Fix is an indicator developed by the 2014 MTA Annual Award...
ETHICS
A Code of Ethics is one of the minimum requirements of a profession. Since its founding in 1974, MTA members have been required to adhere to a comprehensive Code of Ethics. The Code consists of a single page that defines the highest standards of ethics. Although it is brief, the Code is comprehensive and has met the needs of the Association.
If there is a shortcoming in the Code, it was that it did not include a large number of examples or provide additional study material For TAN candidates. This made ethics one of the more challenging topics to study for when preparing for the exams. The Code was clear and comprehensive but without examples, candidates for the exams often felt unprepared for the exams.
To address this concern, the Ethics and Standards Committee set out to develop a detailed Body of Knowledge related to ethics. In their research, they realized the
To view this content you must be an active member of the TAN Association.
Not a member? Join the TAN Association and unlock access to hundreds of hours of written and video technical analysis content, including the Journal of Technical Analysis and the Video Archives. Learn more about Membership here.
Contributor(s)

Craig W. Johnson, CMT, CFA
Craig W. Johnson, CMT, CFA is a Managing Director and Senior Technical Research Analyst currently directing Piper Jaffray's technical research group. Johnson joined Piper Jaffray in 1995 as an analyst in the firm's private client research department. He offers frequent technical...
CMT TEST TO INCLUDE NEW ETHICS STUDY MATERIAL - WITH SAMPLE ETHICS QUESTIONS
One of the advantages of the MTA’s licensing agreement with the CFA Institute is the ability to provide detailed study material for the CMT exam. Clear examples for all parts of the Code and Standards are available. This will help candidates prepare for the exam.
Below are several examples of the types of questions that will be on the October 2015 CMT exam. These questions are intended to demonstrate the type of question and are not actual exam questions.
1. William is the research analyst responsible for following Company X. He uses a relative strength analysis model. This model indicates the stock should be rated a weak “hold.” During lunch, however, William overhears a financial analyst from another firm whom he respects offer opinions using Elliott Wave analysis that conflict indicate the stock is a strong “buy.” Upon returning to his office, William releases a strong “buy” recommendation to the
To view this content you must be an active member of the TAN Association.
Not a member? Join the TAN Association and unlock access to hundreds of hours of written and video technical analysis content, including the Journal of Technical Analysis and the Video Archives. Learn more about Membership here.
IN MEMORIAM: JIM BIRMINGHAM

Long-time MTA member James G. Birmingham passed away on April 18, 2015 at the age of 84. Jim has been a member of the MTA since 1974.
Two of the defining characteristics of Jim’s life were his love of his family and the markets. He spent 59 years working in the markets yet his resume can be condensed into just three lines. Jim served in the Navy, worked briefly for a broker and then managed money through a hedge fund. Just three positions over six decades.
Jim was born in Boston on June 30, 1931 and graduated from Boston College in 1952. From 1953 until 1956, he served as a Lieutenant JG in the United States Navy during the Korean Conflict. After leaving the Navy, Jim started as a broker in Boston with Proctor Cook and Company. As he recalled years later:
“I
To view this content you must be an active member of the TAN Association.
Not a member? Join the TAN Association and unlock access to hundreds of hours of written and video technical analysis content, including the Journal of Technical Analysis and the Video Archives. Learn more about Membership here.
9 MISTAKES QUANTS MAKE THAT CAUSE BACKTESTS TO LIE
Editor’s note: Tucker Balch was one of the presenters at the 2014 Annual Symposium. That presentation can be viewed in the Symposium archives. This was originally posted at The Augmented Trader blog.
 “I’ve never seen a bad backtest” — Dimitris Melas, head of research at MSCI.
About backtests
A backtest is a simulation of a trading strategy used to evaluate how effective the strategy might have been if it were traded historically. Backtestesting is used by hedge funds and other researchers to test strategies before real capital is applied. Backtests are valuable because they enable quants to quickly test and reject trading strategy ideas.
All too often strategies look great in simulation but fail to live up to their promise in live trading. There are a number of reasons for these failures,
To view this content you must be an active member of the TAN Association.
Not a member? Join the TAN Association and unlock access to hundreds of hours of written and video technical analysis content, including the Journal of Technical Analysis and the Video Archives. Learn more about Membership here.
Contributor(s)

Tucker Balch, Ph.D.
Tucker Balch, Ph.D. is a former F-15 pilot, professor at Georgia Tech, and co-founder and CTO of Lucena Research, an investment software startup. His research focuses on topics that range from understanding social animal behavior to the challenges of applying Machine Learning to...
THIRTY TOMORROWS BY MILTON ERZATI
Editor’s note: Milton Erzati was one of the presenters at the recent Annual Symposium. His presentation included some of the information in his book which is reviewed here.
Thirty Tomorrows starts with well-known, bearish demographic facts and then demonstrates that the outlook is actually bullish. Milton Erzati is an economist who does an excellent job summarizing the challenges the global economy faces. Any economic data series can be presented on a chart and as Erzati points out, it can be used to develop a forecast but the right side of the chart (the future) is uncertain and is likely to provide upside surprises. That’s an important point that is often overlooked. Many forecasts consider downside surprises but the upside surprises are often overlooked although they are usually just as likely to occur.
The demographic data Erzati focuses on can be summarized in the dependency ratio, a measure showing the number of dependents
To view this content you must be an active member of the TAN Association.
Not a member? Join the TAN Association and unlock access to hundreds of hours of written and video technical analysis content, including the Journal of Technical Analysis and the Video Archives. Learn more about Membership here.
Contributor(s)

Michael Carr, CMT
Mike Carr, who holds a Chartered Market Technician (CMT) designation, is a full-time trader and contributing editor for Banyan Hill Publishing, a leading investment newsletter service. He is an instructor at the New York Institute of Finance and a contributor to various...

Milton Ezrati
Milton Ezrati, a Partner at Lord Abbett as well as the firm's Senior Economist and Market Strategist, is responsible for economic research and strategy, enabling clients to gain context and a further understanding of today’s global markets. Milton joined Lord Abbett...
20 YEARS PUBLISHING THIS NEWSLETTER
Editor’s note: longevity is rare in the investment newsletter business. It’s certainly not unheard of but it is rare. Tom McClellan has been publishing The McClellan Market Report for 20 years and recently shared some thoughts about the evolution newsletter which is also a story about how technology has changed the world of finance. This article, which was originally posted at McClellan Financial Publications, also includes a list of indicators Tom has developed over the years.
It was in April 1995 that we first started publishing this newsletter. That makes it 20 years ago this month.
When we first started out, it was all printed and mailed. The Internet was already around in 1995, but almost no one knew anything about it. It was a lot of work getting the stacks of
To view this content you must be an active member of the TAN Association.
Not a member? Join the TAN Association and unlock access to hundreds of hours of written and video technical analysis content, including the Journal of Technical Analysis and the Video Archives. Learn more about Membership here.
Contributor(s)

Tom McClellan
Tom McClellan has been editor of The McClellan Market Report since 1995, and is ranked as the #2 Stock Market Timer for 2016 according to Timer Digest. He is the son of Sherman and Marian McClellan, who in 1969 created the McClellan Oscillator and Summation Index. Tom...
AI, MACHINE LEARNING, DATA MINING, AND BIG DATA- HOW DO THEY APPLY TO TRADING?
Editor’s note: this was originally posted at Inovancetech.com and is reprinted her with permission. Inovancetech is offering the free use of an algorithmic trading platform to MTA members
Artificial intelligence, machine learning, data mining and big data seem to get thrown around in everything from business intelligence to financial services.
Artificial intelligence is used where machine learning should be and machine learning is often confused with data mining. The goal of this post is to clarify these buzzwords, explore how they apply to trading and then explore an ideal subcategory of data mining for traders.
Clarifying the Buzzwords
Artificial intelligence, a subfield of computer science, has three main subcategories; machine learning, curated knowledge and reverse engineering the brain. Machine learning is a method of developing algorithms for recognizing patterns within data. Data mining, also a subfield of computer science, is the whole information discovery process; from preparing and cleaning data to analyzing to post
To view this content you must be an active member of the TAN Association.
Not a member? Join the TAN Association and unlock access to hundreds of hours of written and video technical analysis content, including the Journal of Technical Analysis and the Video Archives. Learn more about Membership here.
Contributor(s)

Justin Cahoon
Justin Cahoon is Chief Operating Officer of Inovancetech. The company offers TRAIDE, a platform designed to discover the underlying patterns in the assets and indicators you use to trade. Those patterns can be used to create your own reliable trading strategy. Justin started...
CANADIAN DOLLAR OUTLOOK BRIGHTENS, CHAMELEON OSCILLATOR SUGGESTS
Editor’s note: The Chameleon Oscillator was detailed in the April 23 issue of Bloomberg Brief: Technical Strategies. This article is an extract of that article.
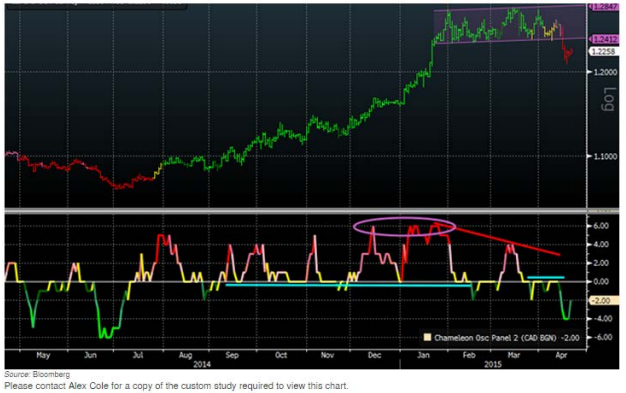
In Bloomberg Brief: Technical Strategies Alex Cole illustrates how the Chameleon Oscillator can be used to spot oversold and overbought extremes. As an example, he showed the Canadian dollar which he believes “has reversed its slide against the U.S. dollar, according to the Trend Chameleon. “ That indicator, shown as a “paint bar study” in the chart above has been pointing towards a potential reversal since April 15. In the chart, we can see the first red bar in the series occurs when prices break to the downside from a consolidation channel that developed after an extended rally.
The chart also shows the Chameleon Oscillator at the
To view this content you must be an active member of the TAN Association.
Not a member? Join the TAN Association and unlock access to hundreds of hours of written and video technical analysis content, including the Journal of Technical Analysis and the Video Archives. Learn more about Membership here.
Contributor(s)

Alex Cole
Alex Cole is a Technical Analysis and Charting product specialist. With over 14 years of financial market experience, Alex has led Technical Analysis and data visualization teams, frequently contributed to financial news/ industry organizations such as Bloomberg and the...
KASE ON TECHNICAL ANALYSIS + ONLINE VIDEO COURSE
We all learn the basics of technical analysts differently. Some of us read the classics and think about how those ideas still apply to the current markets. Some of us find mentors who explain the important concepts to us. Some of us prefer traditional classrooms and other like self-paced video courses. No matter how we learn technical analysis, the next step is to apply the knowledge.
Kase on Technical Analysis is a one-stop training source. Cynthia covers the basics, puts them all together into a coherent trading strategy and then provides tests so you can apply the knowledge without risk in the markets.
The big question is who would benefit from this material. The answer is anyone wanting to learn about technical analysis, anyone studying for the CMT exam and anyone wanting to learn about the Kase suite of indicators or strategies. CMT
To view this content you must be an active member of the TAN Association.
Not a member? Join the TAN Association and unlock access to hundreds of hours of written and video technical analysis content, including the Journal of Technical Analysis and the Video Archives. Learn more about Membership here.
Contributor(s)

Cynthia A. Kase, CMT, MFTA
Cynthia A. Kase, CMT, MFTA is the president of Kase and Company, Inc. CTA, founded in 1992. With a BS UMass and an ME Northeastern, both in chemical engineering, she worked in that field for 10 years before beginning her trading career. She traded physical oil and products, as...
Michael Carr, CMT
Mike Carr, who holds a Chartered Market Technician (CMT) designation, is a full-time trader and contributing editor for Banyan Hill Publishing, a leading investment newsletter service. He is an instructor at the New York Institute of Finance and a contributor to various...
MAPPING THE ACTIVE STRATEGY UNIVERSE
Editor’s note: this article was originally published in Proactive Advisor Magazine and is reprinted here with permission.
A view into how professional strategists might classify active strategies.
When someone is first exposed to actively managed strategies, they may think they just stepped foot on another planet. They hear a new language that includes many foreign terms such as tactical asset allocation, statistical arbitrage, momentum, mean reversion, etc. The complexity can seem overwhelming when compared to the relative simplicity of passive strategies. There appear to be more flavors of active strategies than anyone could ever hope to make sense of.
This article attempts to chart this world through a simple classification scheme. To do that, I will discuss actively managed strategies through the lens of four vectors: time frame, asset classes, systematic factors, and use of discretion. Through a general look at active strategy characteristics, advisors will get a glimpse into performance drivers and
To view this content you must be an active member of the TAN Association.
Not a member? Join the TAN Association and unlock access to hundreds of hours of written and video technical analysis content, including the Journal of Technical Analysis and the Video Archives. Learn more about Membership here.
Contributor(s)

Dave Walton
Dave Walton has been involved in active investing since 1999. Prior to co-founding StatisTrade, Mr. Walton spent 18 years ensuring the quality and reliability of cutting-edge technology products for one of the world’s largest computer chip manufacturers. Mr. Walton received...
21ST CENTURY POINT AND FIGURE BY JEREMY DU PLESSIS, CMT, FSTA
Point and Figure (P&F) is one of the oldest tools of technical analysis. It’s been used since at least the 1880s yet the technique works just as well today as it did 130 years ago. The basics of P&F haven’t changed over time but computers and software have allowed skilled analysts to derive more information from the columns of Xs and Os that are found on P&F charts.
In this book, du Plessis demonstrates how to apply 20th century tools like Bollinger Bands®, Donchian channels and Welles Wilder’s parabolic stop and reverse strategy to P&F charts.
Below are examples from the book showing how Donchian channels could be applied to P&F charts. Donchian channels were developed by Richard Donchain in the 1960s. They consisted of two lines on a price chart. One line showed the highest high over a time period, usually 20 days or 4 weeks. The second line showed the
To view this content you must be an active member of the TAN Association.
Not a member? Join the TAN Association and unlock access to hundreds of hours of written and video technical analysis content, including the Journal of Technical Analysis and the Video Archives. Learn more about Membership here.
Contributor(s)

Jeremy du Plessis, CMT, FSTA
Jeremy du Plessis, who holds the Chartered Market Technician (CMT) designation, has been involved with technical analysis since 1981 and founded Indexia Consulting Ltd to produce technical analysis software. He pioneered the computerization of Point and Figure charts, in...
Michael Carr, CMT
Mike Carr, who holds a Chartered Market Technician (CMT) designation, is a full-time trader and contributing editor for Banyan Hill Publishing, a leading investment newsletter service. He is an instructor at the New York Institute of Finance and a contributor to various...
MICKEY MANTLE STRIKES OUT, THEN HITS A HOMER
A previous blog discussed Wilt Chamberlain’s unsuccessful attempt at following up on his successful basketball career with a successful IPO. Wilt Chamberlain wasn’t the only sports star to go into the restaurant business. Few people realize it, but Mickey Mantle set up restaurants twice, once in Texas in the 1950s when he struck out, and a second time in the 1980s in New York City when he hit a home run.
Mickey Mantle played for the New York Yankees between 1951 and 1968 and is one of the few baseball players to hit over 500 home runs during his career, and believe it or not, without the aid of any steroids. Many consider Mantle to be the greatest switch hitter of all time, a skill which enabled him to hit for both average and for power. His lifetime batting average was 0.298 and he hit some of the longest home runs
To view this content you must be an active member of the TAN Association.
Not a member? Join the TAN Association and unlock access to hundreds of hours of written and video technical analysis content, including the Journal of Technical Analysis and the Video Archives. Learn more about Membership here.
Contributor(s)

Dr. Bryan Taylor
Dr. Bryan Taylor President & Chief Economist, Global Financial Data Dr. Bryan Taylor serves as President and Chief Economist for Global Financial Data. He received his B.A. from Rhodes College, his M.A. from the University of South Carolina in International Relations,...
ETF SECTOR ROTATION
Editor’s note: This was recently published at Alvarez Quant Trading and is reprinted here with permission. A spreadsheet with the complete results of this strategy is available at the web site.
My recent research has been in ETFs which I have not explored in several years. ETF sector rotation has always intrigued me. The idea seems so simple that it should work. Always be in the sector that has been doing the best. I like simple but does it work? If not, can we make it work?
ETF Universe
For these test, we will using the Select Sector SPDR ETFs. They have a long history. The list is
- Consumer Discretionary (XLY)
- Consumer Staples (XLP)
- Energy (XLE)
- Financials (XLF)
- Health Care (XLV)
- Industrials (XLI)
- Materials (XLB)
- Technology (XLK)
- Utilities (XLU)
Testing will be from 2005 to 2014.
Baseline
Our baseline will be buy and hold on the SPY. My typical goal when trading ETFs is to beat CAGR of Buy & Hold by 50% but with
To view this content you must be an active member of the TAN Association.
Not a member? Join the TAN Association and unlock access to hundreds of hours of written and video technical analysis content, including the Journal of Technical Analysis and the Video Archives. Learn more about Membership here.
Contributor(s)

Cesar Alvarez
For the last six years, Cesar Alvaraz has written for his popular quant blog, Alvarez Quant Trading helping traders learn about the markets. He spent nine years as the Director of Research for Connors Research and TradingMarkets.com. Numerous strategies he created have been...
A "SHEER MISERY" MARKET DEFINED
Editor’s note: this article was originally published by the National Association of Active Investment Managers and is reprinted here with permission.
I was recently named Chief Investment Officer at Sowell Management Services, a registered investment advisor that is responsible for about $500 million of client assets. Part of the gig is to communicate all things market related to the portfolio managers, the sales team, and the independent advisors who represent the firm.
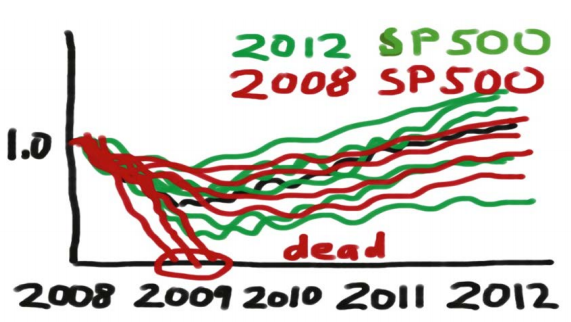
During a staff meeting on Monday, the National Sales Manager wanted my take on the current environment for “tactical” investment strategies. He noted that most tactical managers had a rough go last year and wondered if the environment had changed with the calendar. My response was brief and to the point, “It’s been ‘sheer misery’ in the tactical space since the beginning of 2014… and no, nothing has changed.”
Not surprisingly, I was asked to put “some color” behind my view
To view this content you must be an active member of the TAN Association.
Not a member? Join the TAN Association and unlock access to hundreds of hours of written and video technical analysis content, including the Journal of Technical Analysis and the Video Archives. Learn more about Membership here.
Contributor(s)

Dave Moenning
David D. Moenning is President and Chief Investment Strategist for Heritage Capital Research. Dave owned his own investment management firm and has been managing client accounts on a discretionary basis since 1987. Thus, Dave has been live, on the market's firing line for...
THE MARKETS CONTINUE TO CONSOLIDATE THE BULLS SHOULD WIN THE BATTLE IN THE SECOND QUARTER
Editor’s note: this was published in late-April and is presented as an example of long-term technical analysis.
Two weeks ago our Market Comment summarized the big picture for the 2009-2015 bull market. We concluded that after a 97% gain over nearly three and a half years, the markets were due for a well deserved rest. While some market analysts expect a big correction or even the end of the bull market after such a strong advance, our view is that the markets can remain bullish and “correct” by marking time within a relatively narrow trading range.
What has happened so far? The S&P 500 has moved sideways for two months. Last Friday’s decline, caused mainly by being both option-expiry day and the end of the 70-day cycle, was contained comfortably above the 1,975 to 2,025 zone that we highlighted last time. On Monday the loss was recovered.
As the S&P 500 moves sideways,
To view this content you must be an active member of the TAN Association.
Not a member? Join the TAN Association and unlock access to hundreds of hours of written and video technical analysis content, including the Journal of Technical Analysis and the Video Archives. Learn more about Membership here.
Contributor(s)

Ron Meisels
Ron Meisels is Founder and President of Phases & Cycles Inc. with over 50 years of stock market experience. He specializes in the independent research of Canadian and U.S. securities and market using Behavior Analysis. Institutions ranked him among the top...
SELL IN MAY AND GO AWAY?
Editor’s note: This was published by Intalus at their educational blog. The code for implementing this strategy in Tradesignal is available by clicking here.
HOW TO PROFIT FROM SEASONAL PATTERNS.
Every year, the old adage “Sell in May and go away“ is widely discussed in the financial media. But is this adage reality or just a myth? And can this simple seasonal strategy work at all if everyone knows it? Using Tradesignal; traders, portfolio managers and analysts can examine these and other seasonal pricing anomalies quickly and safely to improve their investment decisions.
EMPIRICAL EVIDENCE FOR SUMMER WEAKNESS
In 1964 the Financial Times wrote about the “Sell in May“ effect, it took decades for the academic world to study this phenomenon, which says shares should be avoided during the summer months. The most comprehensive study on this subject was published in 2002[1]. The research duo Sven Bouman and Ben Jacobsen examined a total of
To view this content you must be an active member of the TAN Association.
Not a member? Join the TAN Association and unlock access to hundreds of hours of written and video technical analysis content, including the Journal of Technical Analysis and the Video Archives. Learn more about Membership here.
Contributor(s)

David Pieper
David Pieper is responsible for editorial content at Intalus and has 15 years experience in the financial markets. After completing his business degree and continuing education to become a Certified International Investment Analyst (CIIA), he spent several years in the...
TECHNICAL ANALYSIS IN ACADEMIA
Technical analysis has been used by traders for centuries. But it has only been taught as a for-credit course at universities since 1996. In that year, the MTA Educational Foundation partnered with the University of Richmond to teach “Technical Analysis and the Securities Market” to undergraduates.
Dick Dickson, CMT, was the instructor in 1996. Dick worked with Professor John Earl, who is now Chair of the University’s Finance Department, Ralph Acampora and Martin Pring to introduce the course to the school. With Dr. Earl’s assistance, a presentation to the Dean was completed and the course which focused on the practical application of technical analysis to the markets was immediately approved.
In addition to learning from Dick, students were provided with insights from some of the country’s leading technical analysts. Ralph Acampora, CMT, Steve Nison, CMT, Alan Shaw, CMT, Phil Roth, CMT and Martin Pring presented as guest lecturers.
One of the students in
To view this content you must be an active member of the TAN Association.
Not a member? Join the TAN Association and unlock access to hundreds of hours of written and video technical analysis content, including the Journal of Technical Analysis and the Video Archives. Learn more about Membership here.
Contributor(s)
Michael Carr, CMT
Mike Carr, who holds a Chartered Market Technician (CMT) designation, is a full-time trader and contributing editor for Banyan Hill Publishing, a leading investment newsletter service. He is an instructor at the New York Institute of Finance and a contributor to various...
CHART OF THE MONTH: THE VIX FIX
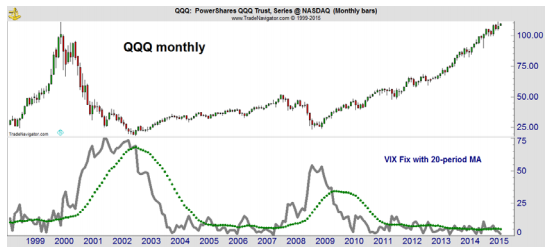
In this year’s Charles H. Dow Award paper, I described how the VIX Fix indicator could be applied as a trading strategy. The VIX Fix is an indicator developed by the 2014 MTA Annual Award winner Larry Williams. It applies the concept of the VIX to any stock or stock market index. Complete details of how the indicator is used are in the paper but the basic idea is that low volatility is bullish. I use a moving average to define when volatility is low or high.
In the first chart below I have applied the VIX Fix to the monthly chart of PowerShares QQQ ETF (QQQ), a tradable security that tracks the NASDAQ 100 index. For now, the VIX Fix is below the moving average and there is no sell signal in this security. The chart highlights how well the indicator works with monthly data to identify bear markets.
To view this content you must be an active member of the TAN Association.
Not a member? Join the TAN Association and unlock access to hundreds of hours of written and video technical analysis content, including the Journal of Technical Analysis and the Video Archives. Learn more about Membership here.
Contributor(s)

Amber Hestla-Barnhart
New Educational Content This Month
-
August 26, 2020

The CMT Experience
Presenter(s): Tyler Wood, Dave Lundgren, CMT, CFA
-
August 26, 2020
Reading the Current Market in Light of History’s Lessons
Presenter(s): Ryan Detrick, CMT
-
August 12, 2020
How to Spot Major Trend Reversals with Elliott Waves and Socionomics: Examples from Asia’s Ongoing Secular Bull Market
Presenter(s): Mark Galasiewski