
LETTER FROM THE EDITOR
 We are once again providing short summaries of several moments from the MTA Symposium and we will have more next month. As usual, there was too much information from the two-day event to summarize quickly. In this month’s summary, we present information about the MTA Annual Award Winner Larry Williams, an article with lessons learned over a lifetime in the industry from Steve Leuthold and the rules for a complete trading strategy from Perry Kaufman.
There is also a review of a book written by Michael E. S. Gayed, the late father of this year’s Charles H. Dow Award co-author Michael Gayed. This book was originally published in 1990. It was recently republished by the author’s son as a tribute to his father’s life and work. While the book is certainly a tribute to an insightful mind, it is also a modern day primer on what’s important in the markets. The section on economic indicators is one of the most practical collections of indicators ever assembled, and each section concludes
We are once again providing short summaries of several moments from the MTA Symposium and we will have more next month. As usual, there was too much information from the two-day event to summarize quickly. In this month’s summary, we present information about the MTA Annual Award Winner Larry Williams, an article with lessons learned over a lifetime in the industry from Steve Leuthold and the rules for a complete trading strategy from Perry Kaufman.
There is also a review of a book written by Michael E. S. Gayed, the late father of this year’s Charles H. Dow Award co-author Michael Gayed. This book was originally published in 1990. It was recently republished by the author’s son as a tribute to his father’s life and work. While the book is certainly a tribute to an insightful mind, it is also a modern day primer on what’s important in the markets. The section on economic indicators is one of the most practical collections of indicators ever assembled, and each section concludes
To view this content you must be an active member of the TAN Association.
Not a member? Join the TAN Association and unlock access to hundreds of hours of written and video technical analysis content, including the Journal of Technical Analysis and the Video Archives. Learn more about Membership here.
What's Inside...
MTA ANNUAL AWARD HONORS LARRY WILLIAMS
by Charlie Bilello, CMT & Michael Gayed, CFA“In recognition of your decades of service to champion technical analysis within the trading and investment communities through speaking engagements, writing and innovation in technical...
TEN LESSONS
by Steve LeutholdWhat follows applies to personal investing, but much of it also applies to professional responsibilities as a portfolio manager. At the tender age of 23, I was a retail stockbroker at Paine Webber....
STOCK TIMING USING PAIRS LOGIC
by Perry J. Kaufman & Michael Carr, CMTEvery MTA Symposium includes a mix of the theoretical and the practical. There are always a few presentations that give some participants new ideas for trading or analysis. Perry Kaufman’s...
INTERMARKET ANALYSIS & INVESTING INTEGRATING ECONOMIC, FUNDAMENTAL, & TECHNICAL INDICATORS
by Michael Gayed, CFA & Michael Carr, CMTA recent headline in The Wall Street Journal explained, “Why Some M.B.A.s Are Reading Plato: Schools Try Philosophy to Get B-School Students Thinking Beyond the Bottom Line.” With only eighteen...
BACK-TESTING WITH INDICATORS & FLUID MODELS
by Matthew A. Pasts, CMTBack-testing refers to testing a trading strategy or a predictive model in the financial markets using historical data. A portfolio manager uses this methodology to cross validate his thesis or...
INTERVIEW WITH PAUL PITSIRONIS, CMT
by Paul Pitsironis, CMT & Amber Hestla-BarnhartHow would you describe your job? I act as the portfolio manager on a team of Financial Advisors at Wells Fargo Advisors LLC in Melville, NY. My main role is to manage the assets of our clients who...
AN UPDATED FORECAST FOR THE NIFTY
PO= Price Objective/ Target The Nifty is a benchmark index for the stock market in India. This report updates our analysis from December 2013 for the Nifty. The Nifty reached our initial upside...
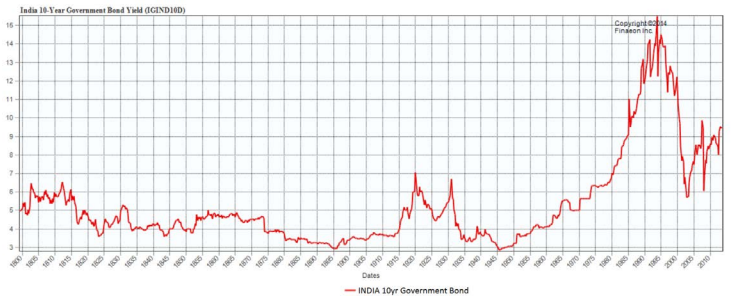
CHART OF THE MONTH INDIA 10-YEAR GOVERNMENT BOND SINCE 1800
This chart is provided by Global Financial Data, a provider of economic and financial data that extends from the 1200s for markets and nations around the world. To learn more, contact Ralph Dillon at...
MTA ANNUAL AWARD HONORS LARRY WILLIAMS
“In recognition of your decades of service to champion technical analysis within the trading and investment communities through speaking engagements, writing and innovation in technical indicator and statistical research.”
The MTA Annual Award winners are recognized for their life-long outstanding contribution to the development and widespread acceptance of technical analysis by institutional practitioners and individual investors. Few have been such prolific contributors as Larry Williams. For decades, Larry has been fully disclosing details of indicators and strategies that really work.
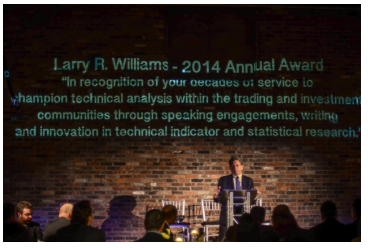
More than a few members of the audience at the 2nd Annual Gala Awards Dinner on April 3rd, 2014 weren’t even born when Larry started his career in the markets. Larry first became interested in the markets when he observed the 1962 market crash.
In introducing Larry at the Dinner, his friend
To view this content you must be an active member of the TAN Association.
Not a member? Join the TAN Association and unlock access to hundreds of hours of written and video technical analysis content, including the Journal of Technical Analysis and the Video Archives. Learn more about Membership here.
Contributor(s)

Charlie Bilello, CMT
Charlie Bilello, who holds the Chartered Market Technician (CMT) designation, is the Director of Research at Pension Partners, LLC, where he is responsible for strategy development, investment research and communicating the firm’s investment themes and portfolio positioning to...

Michael Gayed, CFA
Michael A. Gayed is Portfolio Manager at Toroso Investments, an investment management company specializing in ETF focused research, investment strategies and services designed for financial advisors, RIAs, family offices and investment managers. Prior to Toroso Investments,...
TEN LESSONS
What follows applies to personal investing, but much of it also applies to professional responsibilities as a portfolio manager. At the tender age of 23, I was a retail stockbroker at Paine Webber. From 1961 through 1966, I dealt with individual investors, traders, and a few high-roller speculators. This time span included two bear markets (1962 and 1966). In retrospect, this experience was invaluable as an education in human nature and investor psychology.
Greed and fear are critical stock market elements and also the twin barriers on the road to long-term investment success. In truth, I probably learned more about investor psychology in those years as a retail broker, than in the following 45 years being a relatively detached analyst, portfolio manager, and investment strategist. For a real understanding of investor psychology, I think it is necessary to deal direct rather than from the relatively remote positions of analyst, portfolio manager
To view this content you must be an active member of the TAN Association.
Not a member? Join the TAN Association and unlock access to hundreds of hours of written and video technical analysis content, including the Journal of Technical Analysis and the Video Archives. Learn more about Membership here.
Contributor(s)

Steve Leuthold
Steve Leuthold has been an investment strategist, manager, and researcher for over 45 years. He is Founder of The Leuthold Group, LLC, an institutional investment research firm established in 1981. In 1987, Steve initiated a small investment management operation that is...
STOCK TIMING USING PAIRS LOGIC
Every MTA Symposium includes a mix of the theoretical and the practical. There are always a few presentations that give some participants new ideas for trading or analysis. Perry Kaufman’s presentation at the 2014 Symposium gave attendees he detailed rules for a profitable trading strategy. Back tested results are shown in the figure below.
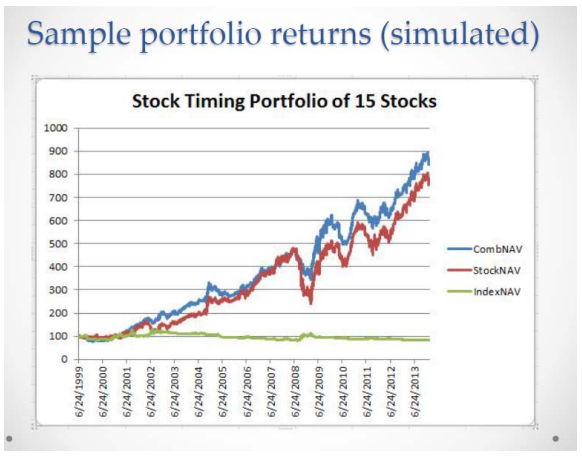
More important than the system rules, Perry provided the detailed though process that goes into developing a trading strategy.
This strategy is based on arbitrage and Perry believes arbitrage is one of the great strategies of all time. Arbitrage can be applied with pairs trading. This requires finding two similar markets which are moving apart. Traders buy the cheaper market and sell the more expensive market, selling when the markets come back together. Arbitrage works in a number
To view this content you must be an active member of the TAN Association.
Not a member? Join the TAN Association and unlock access to hundreds of hours of written and video technical analysis content, including the Journal of Technical Analysis and the Video Archives. Learn more about Membership here.
Contributor(s)

Perry J. Kaufman
Perry J. Kaufman writes extensively on markets and strategies. He began his career as a “rocket scientist,” first working on the Orbiting Astronomical Observatory (OAO-1), the predecessor of the Hubble Observatory, and then on the navigation for Gemini, later used for Apollo...

Michael Carr, CMT
Mike Carr, who holds a Chartered Market Technician (CMT) designation, is a full-time trader and contributing editor for Banyan Hill Publishing, a leading investment newsletter service. He is an instructor at the New York Institute of Finance and a contributor to various...
INTERMARKET ANALYSIS & INVESTING INTEGRATING ECONOMIC, FUNDAMENTAL, & TECHNICAL INDICATORS
A recent headline in The Wall Street Journal explained, “Why Some M.B.A.s Are Reading Plato: Schools Try Philosophy to Get B-School Students Thinking Beyond the Bottom Line.” With only eighteen words, The Journal reminded us why books are important. The true purpose of a book is to prompt the reader to think. Great books provide small pieces of knowledge that can grow to big ideas. By that definition, Intermarket Analysis and Investing is a great book.
Intermarket Analysis and Investing is a valuable reference of economic, fundamental and technical indicators. The book provides an overview of dozens of indicators and then explains how they can be applied. Gayed provides enough information so that the reader knows where they should direct their attention. For example, in reviewing the data series “building permits for homes,”
To view this content you must be an active member of the TAN Association.
Not a member? Join the TAN Association and unlock access to hundreds of hours of written and video technical analysis content, including the Journal of Technical Analysis and the Video Archives. Learn more about Membership here.
Contributor(s)
Michael Gayed, CFA
Michael A. Gayed is Portfolio Manager at Toroso Investments, an investment management company specializing in ETF focused research, investment strategies and services designed for financial advisors, RIAs, family offices and investment managers. Prior to Toroso Investments,...
Michael Carr, CMT
Mike Carr, who holds a Chartered Market Technician (CMT) designation, is a full-time trader and contributing editor for Banyan Hill Publishing, a leading investment newsletter service. He is an instructor at the New York Institute of Finance and a contributor to various...
BACK-TESTING WITH INDICATORS & FLUID MODELS
Back-testing refers to testing a trading strategy or a predictive model in the financial markets using historical data. A portfolio manager uses this methodology to cross validate his thesis or trading strategy. Developed with the benefit of hindsight, back-testing seeks to estimate the performance of a strategy during a past period and assumes that if the strategy worked before, it has a good chance of working again; the opposite is also true, if the concept has not worked well in the past, it may not work well in the future.
Back-testing fixed income models may contribute to trading efficacy. But there are times when a back-tested system will falter, demanding a fluid model that will adjust based on current market action. In the unconstrained fixed income market, back-testing – in conjunction with a fluid modeling process – can contribute to trading efficacy, especially given the current uncertain interest rate environment.
Indicators and
To view this content you must be an active member of the TAN Association.
Not a member? Join the TAN Association and unlock access to hundreds of hours of written and video technical analysis content, including the Journal of Technical Analysis and the Video Archives. Learn more about Membership here.
Contributor(s)

Matthew A. Pasts, CMT
Matthew A. Pasts, CMT, is CEO, Director of BTS Asset Management, Inc., and an Investment Committee Member. Matt joined BTS in 1989. Since that time, he has worked in various capacities at BTS. He graduated with honors from Babson College in Wellesley, MA receiving a BSBA with a...
INTERVIEW WITH PAUL PITSIRONIS, CMT
How would you describe your job?
I act as the portfolio manager on a team of Financial Advisors at Wells Fargo Advisors LLC in Melville, NY. My main role is to manage the assets of our clients who are utilizing our discretionary portfolio management platform (PIM). I decide what is purchased, when it is purchased and, most importantly, when it is sold in our clients’ discretionary portfolios. I manage these portfolios using Technical Analysis as the primary decision making tool. The portfolios are constructed using Exchange Traded Funds (ETFs) that meet certain criteria as determined by the Technical Analysis screens that I have chosen to utilize.
What advice would you have for someone starting in the business today?
I would strongly urge anyone getting in the business today to become familiar in the use of technical analysis to aid in their investment selection process. Becoming a Chartered Market Technician would be a plus
To view this content you must be an active member of the TAN Association.
Not a member? Join the TAN Association and unlock access to hundreds of hours of written and video technical analysis content, including the Journal of Technical Analysis and the Video Archives. Learn more about Membership here.
Contributor(s)

Paul Pitsironis, CMT
About Paul Pitsironis, CMT Over 16 years of financial services experience coupled with the Chartered Market Technicians designation provides Paul with the ability to navigate portfolios through fluctuating market conditions. By utilizing time-tested methodologies, some of which...

Amber Hestla-Barnhart
AN UPDATED FORECAST FOR THE NIFTY
PO= Price Objective/ Target
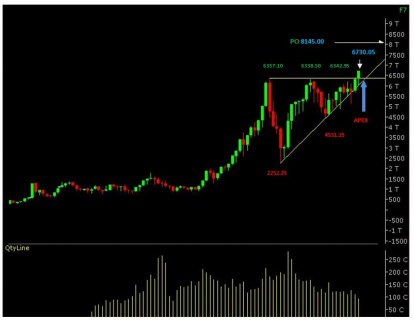
The Nifty is a benchmark index for the stock market in India. This report updates our analysis from December 2013 for the Nifty.
The Nifty reached our initial upside target in March and the rise was supported by buoyant volume.
We noted in December, “As we head towards the apex (the point where both the trend lines meet) we expect this pattern to be resolved with a breakout to the upside. The price breakout would be confirmed with a volume spike that will ultimately confirm a price-volume breakout on the Nifty. We expect this breakout to be followed by a new bull market with an initial upside target of 6700-7300 based on the pattern. Ultimately, our upside target is 8145, about 28% above the previous all time high of
To view this content you must be an active member of the TAN Association.
Not a member? Join the TAN Association and unlock access to hundreds of hours of written and video technical analysis content, including the Journal of Technical Analysis and the Video Archives. Learn more about Membership here.
CHART OF THE MONTH INDIA 10-YEAR GOVERNMENT BOND SINCE 1800
This chart is provided by Global Financial Data, a provider of economic and financial data that extends from the 1200s for markets and nations around the world. To learn more, contact Ralph Dillon at rdillon@gfdfinaeon.com.
To view this content you must be an active member of the TAN Association.
Not a member? Join the TAN Association and unlock access to hundreds of hours of written and video technical analysis content, including the Journal of Technical Analysis and the Video Archives. Learn more about Membership here.
New Educational Content This Month
-
August 26, 2020

The CMT Experience
Presenter(s): Tyler Wood, Dave Lundgren, CMT, CFA
-
August 26, 2020
Reading the Current Market in Light of History’s Lessons
Presenter(s): Ryan Detrick, CMT
-
August 12, 2020
How to Spot Major Trend Reversals with Elliott Waves and Socionomics: Examples from Asia’s Ongoing Secular Bull Market
Presenter(s): Mark Galasiewski