
LETTER FROM THE EDITOR
As always, the MTA Annual Symposium was a success in every sense of the word. The presenters are chosen for their ability to deliver valuable and actionable ideas. Networking opportunities provide a chance to meet with old colleagues and make new contacts. In the past few years, the location has provided out-of-town visitors with expansive views of New York City, allowing for limited sightseeing while maintaining a busy schedule.
In the next few months, videos of many of the presentations will be added to the MTA web site and summaries of the presentations will be presented here.
While the presentations are the core of the Symposium, equally valuable are the vendor exhibits. Many of us turn to the same tools every day. We know there have been new products introduced since we selected our software but we also know that is difficult to keep up with new products and even more difficult to assess the capabilities from a description on a web site. The Symposium always brings together a small group of
To view this content you must be an active member of the TAN Association.
Not a member? Join the TAN Association and unlock access to hundreds of hours of written and video technical analysis content, including the Journal of Technical Analysis and the Video Archives. Learn more about Membership here.
What's Inside...
MTA SYMPOSIUM SYNPOSIS
by JC Parets, CMTEditor’s note: This was originally posted at All Star Charts and is republished here with permission. This week [April 3-5, 2013] was the Market Technicians Association’s annual symposium. It’s...
QUANTIFIABLE EDGES: ASSESSING MARKET ACTION WITH INDICATORS AND HISTORY
by Rob HannaRob Hanna was a presenter in one of the breakout sessions at the May MTA Symposium. Rob’s work is focused on quantitative swing trading, with most of his trades lasting 2-7 days. In addition to...
DYNAMIC MARKET PROFILE
by Mathew Verdouw, CMT, CFTeEditor’s note: Matthew is the creator of Market Analyst software and made a brief presentation at the Symposium. This article expands on some of his ideas. In 1998 I attended an ATAA (Australian...
USING RANDOM PATTERNS TO PREDICT THE S&P500
by Manuel AmunateguiAfter reading Jack Schwager’s latest book, Hedge Fund Market Wizards, I was particularly inspired by Jaffray Woodriff’s interview entitled ‘The Third Way’. Without spoiling the...
HOW TO MAKE MONEY IN STOCKS – SUCCESS STORIES
by Amy Smith & Ajay G. Jani, CMTA search for the term “Investing” on Amazon.com yields over 139,000 results. Each title is presumably about a strategy to beat the market, or at least profit from it. The types of styles...
INTERVIEW WITH MARK ARBETER, CMT
by Mark Arbeter, CMT & Amber Hestla-BarnhartHow would you describe your job and what led you to look at the particular markets you specialize in? My investment career is probably different than most. I quit college after one week (engineering)...
MEMBER PROFILE: RYAN DETRICK, CMT
by Amber Hestla-BarnhartRyan Detrick is the Senior Technical Strategist at Schaeffer’s Investment Research in Cincinnati, Ohio. He joined Schaeffer’s in 2003 and is a frequent speaker and writer on stock market and...
MTA SYMPOSIUM SYNPOSIS
Editor’s note: This was originally posted at All Star Charts and is republished here with permission.
This week [April 3-5, 2013] was the Market Technicians Association’s annual symposium. It’s easily my favorite event of the entire year. I’ve been going to this conference annually since 2006. Just when I thought that it can’t get any better, the Association creates the best one yet. If this is something that you haven’t attended in the past, I strongly suggest coming next year. Some of the top technicians on the planet come together in one place to share insights, strategies, and market wisdom. You can’t beat it.
It’s impossible for me to share everything from the week, but I will try and highlight some of the ideas and moments that stood out to me. Hopefully it will give you some idea of just how awesome the event was.
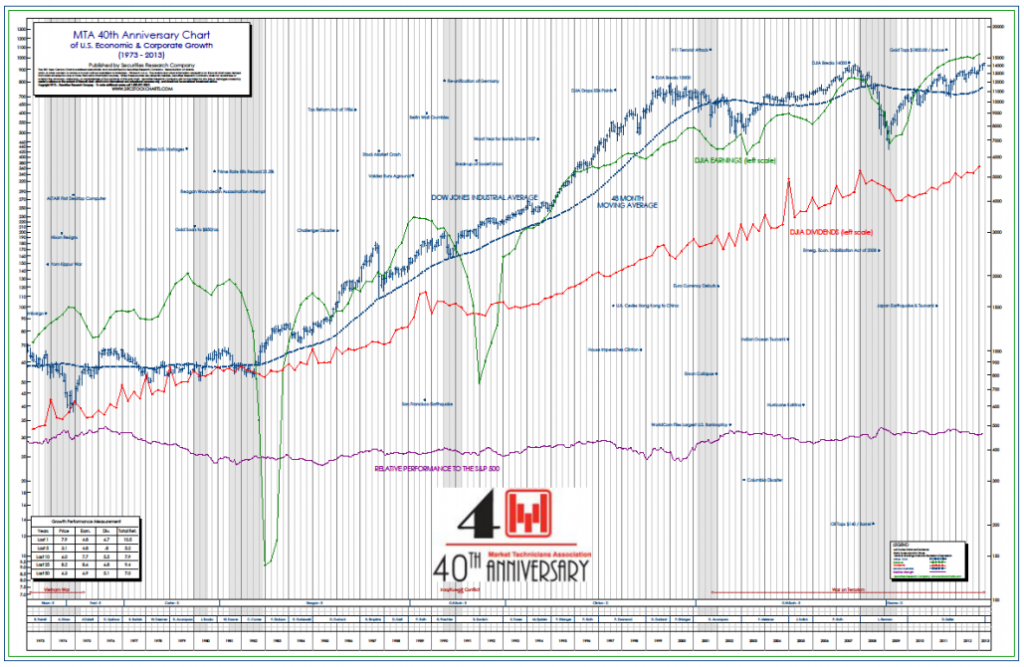
This year marks the 40th anniversary
To view this content you must be an active member of the TAN Association.
Not a member? Join the TAN Association and unlock access to hundreds of hours of written and video technical analysis content, including the Journal of Technical Analysis and the Video Archives. Learn more about Membership here.
Contributor(s)

JC Parets, CMT
JC Parets, who holds a Chartered Market Technician (CMT) designation, is the founder of All Star Charts and is one of the most widely followed Technical Analysts in the world. All Star Charts is a research platform for both professional and retail investors covering US and...
QUANTIFIABLE EDGES: ASSESSING MARKET ACTION WITH INDICATORS AND HISTORY
Rob Hanna was a presenter in one of the breakout sessions at the May MTA Symposium. Rob’s work is focused on quantitative swing trading, with most of his trades lasting 2-7 days.
In addition to providing an overview of his work, Rob also offered several specific and timely trading ideas. An example of his more recent work, from his blog Quantifiable Edges, is shown in the box below.
MONDAY, APRIL 29, 20 1 3
What Recent Moves Up Suggests About the Pullback That Began On Friday
Strong, persistent moves often do not roll over immediately. Real persistency can set up a situation where strength begets more strength. An example of that concept was triggered with Friday’s setup, where we had the 1st down day after 5 consecutive higher closes.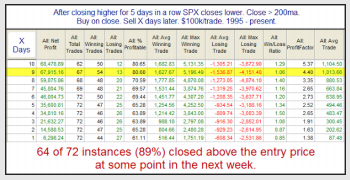
Initially
To view this content you must be an active member of the TAN Association.
Not a member? Join the TAN Association and unlock access to hundreds of hours of written and video technical analysis content, including the Journal of Technical Analysis and the Video Archives. Learn more about Membership here.
Contributor(s)

Rob Hanna
Rob Hanna has been a full-time market professional since 2001 and has served as president of Hanna Capital Management, LLC since that time. He first began publishing his market views and research in 2003. From 2003 to 2007 his column “Rob Hanna’s Putting It All...
DYNAMIC MARKET PROFILE
Editor’s note: Matthew is the creator of Market Analyst software and made a brief presentation at the Symposium. This article expands on some of his ideas.
In 1998 I attended an ATAA (Australian Technical Analysts Association) meeting in Canberra and heard Ray Barros speak on Market Profile. He explained its construction and how the zones and the shape of the bell curve can be used to help a trader in making trading decisions. The only problem was I thought that the tradition of placing a Market Profile on yesterday and having it dictate my decisions today would be an issue if it was neglecting what was happening today. Many years had passed and I often thought back to that presentation and thought that there must be another way to get the same benefits and have those benefits adapt as the market trades.
In this paper I would like to take you through
To view this content you must be an active member of the TAN Association.
Not a member? Join the TAN Association and unlock access to hundreds of hours of written and video technical analysis content, including the Journal of Technical Analysis and the Video Archives. Learn more about Membership here.
Contributor(s)

Mathew Verdouw, CMT, CFTe
Mathew Verdouw, who holds a Chartered Market Technician (CMT) designation, is the CEO and Founder of Optuma, and has been living and breathing Technical Analysis for over 22 years. As a Computer Systems Engineer he wrote his own TA platform, which has been used all over the...
USING RANDOM PATTERNS TO PREDICT THE S&P500
After reading Jack Schwager’s latest book, Hedge Fund Market Wizards, I was particularly inspired by Jaffray Woodriff’s interview entitled ‘The Third Way’. Without spoiling the read, Jaffray neither trades the trend nor the reversal, but an altogether different approach. He runs QIM, a successful systematic fund, where he uses pattern recognition based only on the daily High, Low, Open, and Close prices. From there he devises thousands of patterns to predict where the market will go over the next 24 hours.
“…I blindly search through the data. It’s nice that people want hypotheses that make sense. But I thought that was very limiting. I want to be able to search the rest of the stuff.”
(Quote from Jaffray Woodriff – Schwager, 150)
I have been pondering that theme for over six months now. The interview reveals few details on his approach, but the gist is intriguing enough to warrant
To view this content you must be an active member of the TAN Association.
Not a member? Join the TAN Association and unlock access to hundreds of hours of written and video technical analysis content, including the Journal of Technical Analysis and the Video Archives. Learn more about Membership here.
Contributor(s)

Manuel Amunategui
Manuel Amunategui has worked on Wall Street in the options industry for over six years. He now lives in Portland, Oregon and spends most of his time in the data and data-mining industry but still finds time to experiment and run trading systems. He can be reached at...
HOW TO MAKE MONEY IN STOCKS – SUCCESS STORIES
A search for the term “Investing” on Amazon.com yields over 139,000 results. Each title is presumably about a strategy to beat the
market, or at least profit from it. The types of styles advocated vary from high frequency trading to long term trend following to deep value investing and everything in between. Some books focus on fundamental analysis while others rely on technical patterns. Most books infer that the author was able to use the prescribed strategies to successfully navigate turbulent markets and generate attractive returns. However, very few books describe in detail the author’s level of success as an investor; the reader is left to assume that success has in fact been achieved. Sifting through 139,000 titles to separate the wheat from the chaff can be a challenging exercise for those looking to find helpful advice on investment strategy and tactics.
How
To view this content you must be an active member of the TAN Association.
Not a member? Join the TAN Association and unlock access to hundreds of hours of written and video technical analysis content, including the Journal of Technical Analysis and the Video Archives. Learn more about Membership here.
Contributor(s)

Amy Smith
Bio Coming

Ajay G. Jani, CMT
Ajay G. Jani, who holds a Chartered Market Technician (CMT) designation, is the Managing Partner and CIO of Single A Capital. He has been in the investment business as a technical analyst since 1989, and was previously the Managing Director of Gramercy, an asset management...
INTERVIEW WITH MARK ARBETER, CMT
How would you describe your job and what led you to look at the particular markets you specialize in?
My investment career is probably different than most. I quit college after one week (engineering) and started working for a very successful manufacturing company that was listed on the AMEX. I saw how successful they were and how well they were run so I started buying their stock at the ripe old age of 19. I did very well and decided to start taking business classes at night. After five years of working and investing, I made enough money to go back to college full-time and pay for it myself. I finished undergrad and grad school in four years. It helped living at home. Along the way, a broker gave me a copy of S&P’s Trendline chart book and I guess the rest was history. Charts made sense in evaluating an investment,
To view this content you must be an active member of the TAN Association.
Not a member? Join the TAN Association and unlock access to hundreds of hours of written and video technical analysis content, including the Journal of Technical Analysis and the Video Archives. Learn more about Membership here.
Contributor(s)
Mark Arbeter, CMT
Mark Arbeter, CMT, is currently the President of Arbeter Investments LLC and runs a newsletter entitled "On The Mark" focusing on technical analysis of the U.S. markets. Mark recently ended a 26-year career with Standard & Poor’s Equity Research as their Chief Technical...
Amber Hestla-Barnhart
MEMBER PROFILE: RYAN DETRICK, CMT
Ryan Detrick is the Senior Technical Strategist at Schaeffer’s Investment Research in Cincinnati, Ohio. He joined Schaeffer’s in  2003 and is a frequent speaker and writer on stock market and economic issues and is widely sought after by financial media for his expertise and commentary. With a decade of financial industry experience in the investment and financial services area, strengths include short-term trading with an eye toward timely technical- and sentiment-based trading opportunities, and advanced option trading strategies. Ryan’s formal education includes a BA in finance from Xavier University and an MBA in finance from Miami University. His ongoing professional education included earning his CMT.
To learn more about how to build a successful career in the financial industry I asked Ryan for some more information about where he works, his job, and what he thinks about the current state of the market.
Schaeffer’s
To view this content you must be an active member of the TAN Association.
Not a member? Join the TAN Association and unlock access to hundreds of hours of written and video technical analysis content, including the Journal of Technical Analysis and the Video Archives. Learn more about Membership here.
Contributor(s)
Amber Hestla-Barnhart
CHART OF THE MONTH
To view this content you must be an active member of the TAN Association.
Not a member? Join the TAN Association and unlock access to hundreds of hours of written and video technical analysis content, including the Journal of Technical Analysis and the Video Archives. Learn more about Membership here.
New Educational Content This Month
-
August 26, 2020

The CMT Experience
Presenter(s): Tyler Wood, Dave Lundgren, CMT, CFA
-
August 26, 2020
Reading the Current Market in Light of History’s Lessons
Presenter(s): Ryan Detrick, CMT
-
August 12, 2020
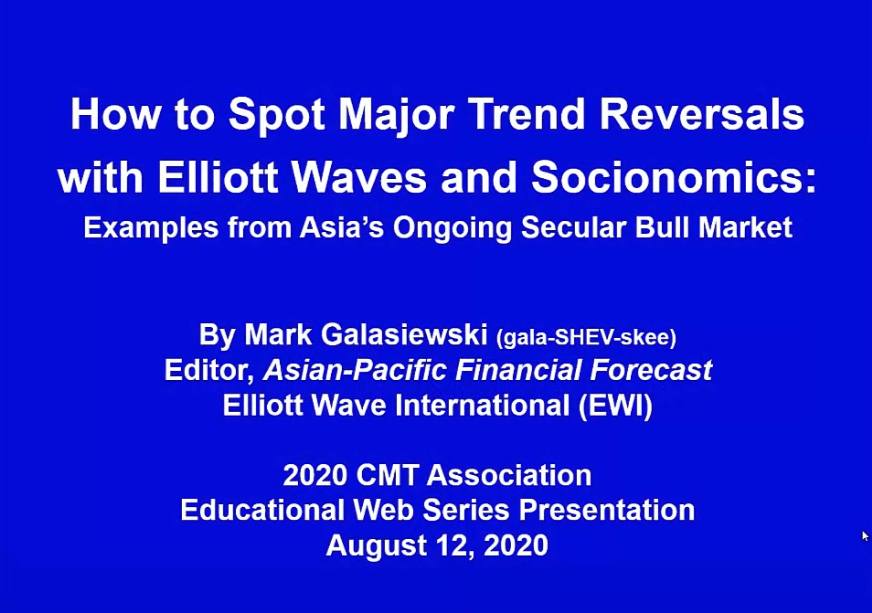
How to Spot Major Trend Reversals with Elliott Waves and Socionomics: Examples from Asia’s Ongoing Secular Bull Market
Presenter(s): Mark Galasiewski