
LETTER FROM THE EDITOR
The MTA recently announced this year’s award winners:- Walter Deemer – Annual Award
- Frederic Dickson – Memorial Award
- Brad Herndon – Service Award
- Stanley Dash – Recognition Award
- Amber Hestla-Barnhart – Charles H. Dow Award
To view this content you must be an active member of the TAN Association.
Not a member? Join the TAN Association and unlock access to hundreds of hours of written and video technical analysis content, including the Journal of Technical Analysis and the Video Archives. Learn more about Membership here.
What's Inside...
2015 MTA ANNUAL AWARD WINNER: WALTER DEEMER
Walter Deemer began his Wall Street career in July, 1963 as a Merrill Lynch research trainee. In April, 1964, he moved to their Market Analysis Department, where he worked directly under Bob...
WALTER DEEMER: ONE MEMO AND TWO CHARTS
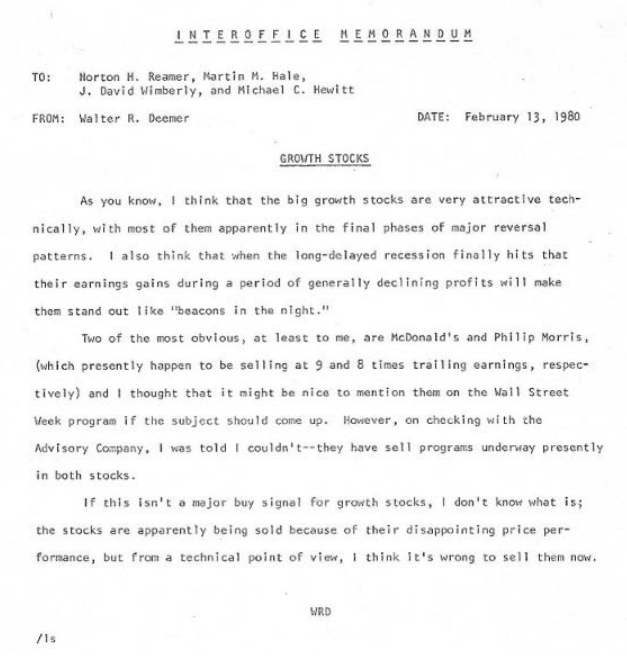
Editor’s note: there are many examples of Walt Deemer’s real time market calls. The one below illustrates Walt’s market timing ability and offers a glimpse of his personality. The memo he wrote...
2015 CHARLES H. DOW AWARD WINNER: FIXING THE VIX: AN INDICATOR TO BEAT FEAR
by Amber Hestla-BarnhartThe Charles H. Dow Award highlights outstanding research in technical analysis. Winning papers have created successful trading systems, insights into theories of how markets function and have...
THE REAL DEAL
by Dean LeBaron, CFA & Walter Deemer & Mark UngewitterEditor’s note: This is an example of the type of work Walt Deemer, this year’s MTA Annual Winner is known for. The work is innovative and long term. The original article can be found at Walt’s...
WORLD WAR
by Charlie Bilello, CMTEditor’s note: Charles Bilello, CMT, CPA, will be sharing his latest work in a presentation at the MTA Symposium later this month. This article was originally published at PensionPartners.com and...
TECHNICAL TRADING RULE PROFITABILITY AND FOREIGN EXCHANGE INTERVENTION
by Blake LeBaronEditor’s note: This is an extract of a paper written by Dr. LeBaron in July 1994 and revised in March 1996. It is as thought provoking today as when it was first published. Dr. LeBaron examines the...
WRITING A DOW AWARD WINNING PAPER: WHY AND HOW
by Amber Hestla-BarnhartEditor’s note: this article is intended to answer the question of what type of process produces an Award winning paper. Before I start, I need to say I am humbled by the Charles H. Dow Award. I...
THE WORLD’S FIRST BEAR MARKET
by Dr. Bryan TaylorEditor’s note: this was originally published at the Global Financial Data blog and is reprinted here with permission. The United States stock market is in the sixth year of a bull market which...
FLAGS AT WORK
by Cornelius LucaEditor’s note: This was originally published by Thompson Reuters and is reprinted here with permission. A trend continuation formation typically consists of an up or down move, a pause in that...
INTERVIEW WITH ADAM O’DELL
by Adam Grant O'Dell & Amber Hestla-BarnhartHow would you describe your job? My ultimate goal is to provide people with actionable investment ideas… ideas they can easily implement as part of a comprehensive wealth-building plan. That...
CHART OF THE MONTH - FROM BLOOMBERG BRIEF: TECHNICAL STRATEGIES
In the February 26 issue of Bloomberg Brief: Technical Strategies, Alex Cole, a technical analysis specialist in the analytics department at Bloomberg LP in New York, showed how the Trend Chameleon...
2015 MTA ANNUAL AWARD WINNER: WALTER DEEMER
Walter Deemer began his Wall Street career in July, 1963 as a Merrill Lynch research trainee. In April, 1964, he moved to their Market Analysis Department, where he worked directly under Bob Farrell, and he has been a full-time market analyst ever since.

In February, 1966, Walter joined Tsai Management and Research just before the initial offering of the Manhattan Fund. In May, 1970, he went to the Putnam Management Company in Boston, one of the most prestigious money management firms in the world at the time(!) and headed Putnam’s Market Analysis Department throughout the ten years he worked there. For part of that time, Walter was a full member of Putnam’s Investment Policy Committee, and he was promoted to Senior Vice President in 1976.
Walter formed his own company, Deemer Technical Research Inc., in July 1980, which has successfully offered his market
To view this content you must be an active member of the TAN Association.
Not a member? Join the TAN Association and unlock access to hundreds of hours of written and video technical analysis content, including the Journal of Technical Analysis and the Video Archives. Learn more about Membership here.
WALTER DEEMER: ONE MEMO AND TWO CHARTS
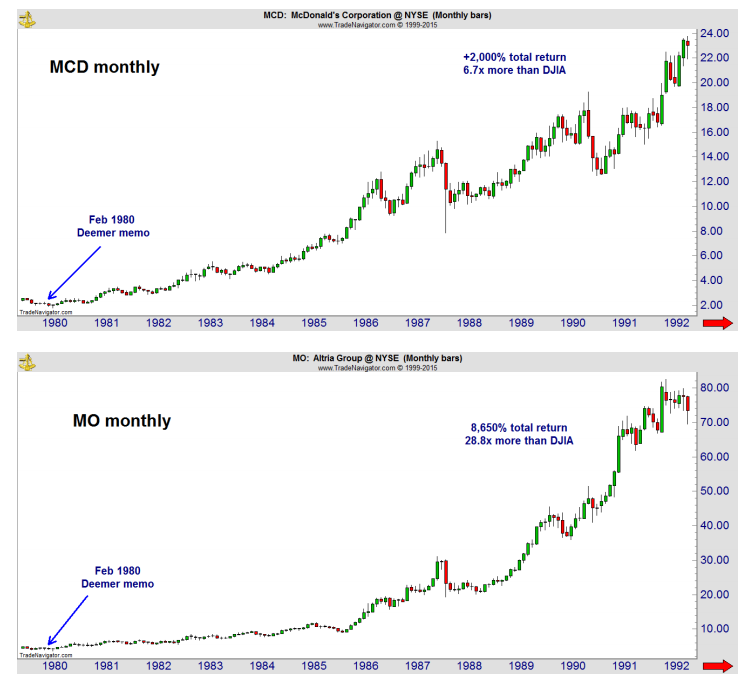
Editor’s note: there are many examples of Walt Deemer’s real time market calls. The one below illustrates Walt’s market timing ability and offers a glimpse of his personality. The memo he wrote in February 1980 is followed by charts showing how well the stocks mentioned below performed.
To view this content you must be an active member of the TAN Association.
Not a member? Join the TAN Association and unlock access to hundreds of hours of written and video technical analysis content, including the Journal of Technical Analysis and the Video Archives. Learn more about Membership here.
2015 CHARLES H. DOW AWARD WINNER: FIXING THE VIX: AN INDICATOR TO BEAT FEAR
The Charles H. Dow Award highlights outstanding research in technical analysis. Winning papers have created successful trading systems, insights into theories of how markets function and have represented the richness and depth of technical analysis. This year’s Dow Award winner, Amber Hestla-Barnhart, demonstrates how to profitably apply an indicator that has been in the public domain since 2007. Larry Williams, the 2014 MTA Annual Award winner, explained the VIX Fix in 2007. This year, Amber explains she has created a complete trading strategy based on that indicator. Fixing the VIX includes test results of that strategy applied to stocks and put options.
The paper’s abstract summarizes the content:
Volatility is widely considered to be a category of technical indicators with a simple interpretation – no matter how it is measured volatility is widely believed to rise in a market downturn. This approach is applied to indicators such as the Average
To view this content you must be an active member of the TAN Association.
Not a member? Join the TAN Association and unlock access to hundreds of hours of written and video technical analysis content, including the Journal of Technical Analysis and the Video Archives. Learn more about Membership here.
Contributor(s)

Amber Hestla-Barnhart
THE REAL DEAL
Editor’s note: This is an example of the type of work Walt Deemer, this year’s MTA Annual Winner is known for. The work is innovative and long term. The original article can be found at Walt’s web site, www.walterdeemer.com.
”What is fascinating is the extent to which gold still holds reign over the financial system as the ultimate source
of payment.”
– Alan Greenspan, Sept. 9, 2009
Introduction
In November 2008, we issued a research paper entitled “A Way Forward,” which examined historic booms and busts from a variety of perspectives, including an analysis of inflation-adjusted equity prices.[1] For this we utilized a classic inter-market study, the Dow/Gold ratio. We noted that equities in gold terms have essentially moved sideways over the centuries, with Dow and gold attaining near-parity every 40-50 years. We also noted a strong connection between Dow/Gold and P/E multiples. Chart
To view this content you must be an active member of the TAN Association.
Not a member? Join the TAN Association and unlock access to hundreds of hours of written and video technical analysis content, including the Journal of Technical Analysis and the Video Archives. Learn more about Membership here.
Contributor(s)
Dean LeBaron, CFA
Dean LeBaron, CFA, is an author, contrarian thinker, and founder of Batterymarch Financial Management

Walter Deemer
Walter Deemer is a founding member and past president of the TAN Association who began his Wall Street career in July 1963 as a Merrill Lynch research trainee. In April 1964, Walter moved to Merrill Lynch's Market Analysis Department, where he worked under Bob Farrell, and was a...
Mark Ungewitter
Mark Ungewitter is a portfolio manager at Charter Trust Company.
WORLD WAR
Editor’s note: Charles Bilello, CMT, CPA, will be sharing his latest work in a presentation at the MTA Symposium later this month. This article was originally published at PensionPartners.com and is reprinted here with permission.
In a world of slowing growth, currency debasement has become the economic weapon of choice.
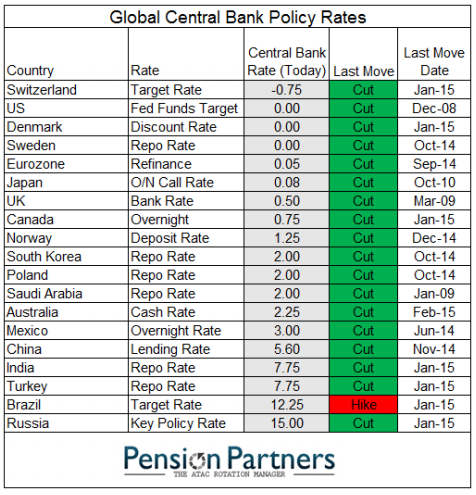
In the last month alone, we have seen central banking easing measures announced in Romania, India, Switzerland, Egypt, Peru, Denmark, Turkey, Canada, the Eurozone (QE), Pakistan, Albania, Russia, Australia, and China.
More cuts are on the way, we are told, as there is seemingly no end in sight to the tit for tat moves of this global currency war. If we look around the world at the major central banks, with the exception of Brazil (who has been forced to hike because of
To view this content you must be an active member of the TAN Association.
Not a member? Join the TAN Association and unlock access to hundreds of hours of written and video technical analysis content, including the Journal of Technical Analysis and the Video Archives. Learn more about Membership here.
Contributor(s)

Charlie Bilello, CMT
Charlie Bilello, who holds the Chartered Market Technician (CMT) designation, is the Director of Research at Pension Partners, LLC, where he is responsible for strategy development, investment research and communicating the firm’s investment themes and portfolio positioning to...
TECHNICAL TRADING RULE PROFITABILITY AND FOREIGN EXCHANGE INTERVENTION
Editor’s note: This is an extract of a paper written by Dr. LeBaron in July 1994 and revised in March 1996. It is as thought provoking today as when it was first published. Dr. LeBaron examines the impact Fed intervention had on technical signals in the foreign exchange market. With the Fed now routinely intervening in various markets, the research is perhaps more timely than when it was originally completed. The full paper can be found at SSRN. Dr, LeBaron will be making a presentation about his most recent work at the upcoming MTA Symposium.
Abstract
There is reliable evidence that simple rules used by traders have some predictive value over the future movement of foreign exchange prices. This paper will review some of this evidence and discuss the economic magnitude of this predictability. The profitability of these trading rules will then be analyzed in connection with central bank activity using intervention
To view this content you must be an active member of the TAN Association.
Not a member? Join the TAN Association and unlock access to hundreds of hours of written and video technical analysis content, including the Journal of Technical Analysis and the Video Archives. Learn more about Membership here.
Contributor(s)

Blake LeBaron
Dr. Blake LeBaron is the Abram L. and Thelma Sachar Chair of International Economics at the International Business School, Brandeis University. LeBaron was at the University of Wisconsin from 1988-1998, and also served as director of the Economics Program at The Santa Fe...
WRITING A DOW AWARD WINNING PAPER: WHY AND HOW
Editor’s note: this article is intended to answer the question of what type of process produces an Award winning paper.
Before I start, I need to say I am humbled by the Charles H. Dow Award. I believe this Award demonstrates the unlimited opportunities in technical analysis for anyone willing to seriously study the subject. The keys to success are widely available – hundreds and probably thousands of brilliant technicians have shared their work over the years and anyone can benefit from their wisdom. Not every article or book will be useful but everyone should be able to find a few ideas they can build on in the literature. Without the ideas others have so freely shared, I would not be able to work in the field I have grown to love. It is because of the generous tradition of publishing indicators and strategies that I have been able to make
To view this content you must be an active member of the TAN Association.
Not a member? Join the TAN Association and unlock access to hundreds of hours of written and video technical analysis content, including the Journal of Technical Analysis and the Video Archives. Learn more about Membership here.
Contributor(s)
Amber Hestla-Barnhart
THE WORLD’S FIRST BEAR MARKET
Editor’s note: this was originally published at the Global Financial Data blog and is reprinted here with permission.
The United States stock market is in the sixth year of a bull market which began on March 9, 2009. Because the average bull market lasts around four years, some fear the stock market may soon be facing a downward correction. By our count, there have been 25 bear markets in the United States since 1792 and 28 bear markets in the United Kingdom since 1692.
When did the bear first raise its head? GFD’s analytical software shows that the first bear market began in 1692 when a four-year stock market decline began in England. If we take the price of East India Company stock from March 1692 until November 1696, and the price of Bank of England stock from August 1694 until October 1696, the market fell almost 72% in the four years
To view this content you must be an active member of the TAN Association.
Not a member? Join the TAN Association and unlock access to hundreds of hours of written and video technical analysis content, including the Journal of Technical Analysis and the Video Archives. Learn more about Membership here.
Contributor(s)

Dr. Bryan Taylor
Dr. Bryan Taylor President & Chief Economist, Global Financial Data Dr. Bryan Taylor serves as President and Chief Economist for Global Financial Data. He received his B.A. from Rhodes College, his M.A. from the University of South Carolina in International Relations,...
FLAGS AT WORK
Editor’s note: This was originally published by Thompson Reuters and is reprinted here with permission.
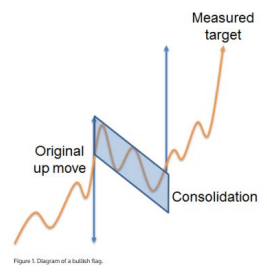
A trend continuation formation typically consists of an up or down move, a pause in that direction, and then the resumption of that move in the original direction. The flag pole is the cumulative range of the original move. The consolidation of the flag typically consists of a parallelogram-shaped area which implies a piece of material fitted on a pole. Once the consolidation breaks and the price trend resumes in the original direction, simply extrapolate the full length of the flag pole from the breakout point to obtain the measured target of the trend continuation formation. Figure 1 shows the diagram of a bullish flag.
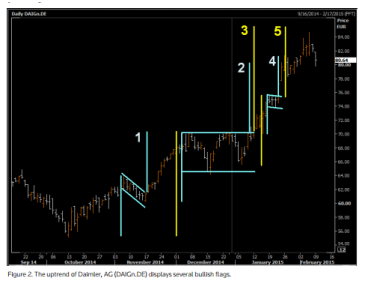
The uptrend of Daimler, AG
To view this content you must be an active member of the TAN Association.
Not a member? Join the TAN Association and unlock access to hundreds of hours of written and video technical analysis content, including the Journal of Technical Analysis and the Video Archives. Learn more about Membership here.
Contributor(s)

Cornelius Luca
Corelius Luca authored “Trading in the Global Currencies Markets,” published by Prentice Hall (3rd edition – 2007), a comprehensive analysis of the foreign exchange markets, instruments, players and methods of forecasting, and “Technical Analysis Applications in the...
INTERVIEW WITH ADAM O’DELL
How would you describe your job?
My ultimate goal is to provide people with actionable investment ideas… ideas they can easily implement as part of a comprehensive wealth-building plan.
That process begins with research. Not research into individual companies or stocks, rather data-driven research into fundamentally-sound and statistically-robust investment strategies. I’ve seen that most self-directed investors are forced to choose between passive index (“buy-and-hope”) and discretionary stock-picking. Those approaches are far from optimal, so I aim to show investors a number of rock-solid alternatives that fall somewhere in the middle.
What led you to look at the particular markets you specialize in?
I wouldn’t say that I specialize in particular markets. I’ve traded foreign currencies, commodities, bonds, stocks and stock options. Yes, there are nuances and “personalities” unique to each. But generally speaking, specific market nuances don’t typically give investors unique opportunities to build wealth. Only robust strategies can provide those opportunities. Here’s what
To view this content you must be an active member of the TAN Association.
Not a member? Join the TAN Association and unlock access to hundreds of hours of written and video technical analysis content, including the Journal of Technical Analysis and the Video Archives. Learn more about Membership here.
Contributor(s)

Adam Grant O’Dell
Adam Grant O'Dell, who holds the Chartered Market Technician (CMT) designation, is the Chief Investment Strategist for Dent Research, a private investment research company. Leveraging his expertise in systems development, Adam created the company's premier investment...
Amber Hestla-Barnhart
CHART OF THE MONTH - FROM BLOOMBERG BRIEF: TECHNICAL STRATEGIES
In the February 26 issue of Bloomberg Brief: Technical Strategies, Alex Cole, a technical analysis specialist in the analytics department at Bloomberg LP in New York, showed how the Trend Chameleon study could be used to identify the direction of the primary trend in the market.
As he explained, “The Trend Chameleon study is based on four criteria:
- The MACD and its signal line relative to zero.
- The spread between the moving average of open prices and moving average of close prices.
- Price momentum, measured by an increase in price between the beginning and end of the specified time span.
- Price relative to a simple moving average.
The price chart is colored bright green when all four criteria are positive and bright red when all are negative. Pink, yellow and dark green correspond to one, two, and three criteria being positive. The time horizon for moving average and momentum periods can be customized. In these charts,
To view this content you must be an active member of the TAN Association.
Not a member? Join the TAN Association and unlock access to hundreds of hours of written and video technical analysis content, including the Journal of Technical Analysis and the Video Archives. Learn more about Membership here.
New Educational Content This Month
-
August 26, 2020

The CMT Experience
Presenter(s): Tyler Wood, Dave Lundgren, CMT, CFA
-
August 26, 2020
Reading the Current Market in Light of History’s Lessons
Presenter(s): Ryan Detrick, CMT
-
August 12, 2020
How to Spot Major Trend Reversals with Elliott Waves and Socionomics: Examples from Asia’s Ongoing Secular Bull Market
Presenter(s): Mark Galasiewski