 Letter from the Editor
Every May, the MTA holds its Annual Symposium and technicians converge in New York to see old friends, meet new ones, and learn about the markets. This year was the largest gathering in history, with 350 members and affiliates from around the world gathering at the New York Stock Exchange (NYSE).
The venue offered an interesting perspective on technical analysis. One of the fundamental principles of technical analysis is that history repeats itself. Without thinking, the NYSE seems to be a symbol of change, at least in the modern era. Electronic algorithms and high frequency trading have reshaped the investment landscape, and the Exchange has been on the leading edge of technology to adapt to penny spreads and an ever-evolving market structure.
On breaks, the Symposium attendees had a chance to wander the hallowed halls of finance sitting at the corner of Wall and Broad. Some history is displayed in those halls, a collection of pictures and memorabilia. In some ways, the Symposium was what it must feel like for a baseball
To view this content you must be an active member of the TAN Association.
Not a member? Join the TAN Association and unlock access to hundreds of hours of written and video technical analysis content, including the Journal of Technical Analysis and the Video Archives. Learn more about Membership here.
What's Inside...
Technical Analysis for Global Real Estate Investing - Presented by Ken Winans, CMT and Dr. Bryan Taylor at the 2011 Annual Symposium
by Ken Winans, CMT & Dr. Bryan Taylor & Michael Carr, CMTKen Winans, CMT, opened the 2011 Annual Symposium with a talk on the state of the real estate markets. Technical analysis can be applied to any freely traded market, and real estate fits that...
Introduction to Gann Squares - Presented by Mathew Verdouw at the 2011 Annual Symposium
by Mathew Verdouw, CMT, CFTe & Michael Carr, CMTW. D. Gann was a legendary Wall Street trader in the early 1900s. He was a student of the markets and came up with a number of innovative trading strategies. Gann’s legendary status is largely...
MTA Educational Foundation (MTAEF) Presentation at the Annual Symposium
by Phil Roth, CMTBruce Kamich, CMT and I were heartened by the attendance at our presentation about the Educational Foundation at the MTA Annual Symposium. We had a standing-room-only crowd in a Board room of the...
RRG – A New Tool for Visualizing Relative Strength in Global Markets - Presented by Julius de Kempenaer at the 2011 Annual Symposium
by Julius de Kempenaer & Michael Carr, CMTJulius began his presentation by highlighting the reality that investing is a process of making choices. The first choice an investor would seem to face is whether to invest or not, however some...
Why You Should Care About Market Structure - Presented by Lawrence Leibowitz and Steven Poser at the 2011 Annual Symposium.
by Lawrence Leibowitz & Steve Poser & Michael Carr, CMTLawrence began this presentation by pointing out that market structure impacts all traders and investors. Direct impacts come from the fact that markets are more fragmented than ever before. There...
Interview with Kirk Northington
by Kirk Northington, CMT & Amber Hestla-BarnhartHow would you describe your job? I create advanced analytical tools and methods for technical analysis charting platforms. My methods and tools are primarily based on volatility arithmetic. I build...
Stocks in the Very Long-Term
by Michael Carr, CMTTechnical analysis is often associated with short-term trading. Long-term charts can offer a different perspective. Few take the time to look at a fifty-year chart of the Dow Jones Industrial...
MTA Announcements
MTA Membership Dues Renewal Approximately 25% of our membership has dues expiring in the months of June and July. It is important that you renew in a timely fashion to ensure there is no disruption...
Technical Analysis for Global Real Estate Investing - Presented by Ken Winans, CMT and Dr. Bryan Taylor at the 2011 Annual Symposium
Ken Winans, CMT, opened the 2011 Annual Symposium with a talk on the state of the real estate markets. Technical analysis can be applied to any freely traded market, and real estate fits that definition. Ken has pioneered this idea and developed a unique price index, the Winans International Real Estate Index (WIREI) which offers history that goes back to 1830. It is obvious when confronted with long-term data that real estate has a history of volatility and prices actually do move both up and down.
Real estate actually offers much of the same data that a stock or futures market does. Price data is available through a variety of indexes. Just as with the stock market, it is important to understand how the index is calculated. There is also an inevitable delay with reporting real estate data and each available index clearly explains its calculation method and reporting lag time.
Although
To view this content you must be an active member of the TAN Association.
Not a member? Join the TAN Association and unlock access to hundreds of hours of written and video technical analysis content, including the Journal of Technical Analysis and the Video Archives. Learn more about Membership here.
Contributor(s)

Ken Winans, CMT
Ken Winans, CMT President & Founder, Winans Investments For 28 years, Ken Winans, CMT, has conducted groundbreaking financial research within the discipline of technical analysis while serving as a portfolio manager, investment analyst, broker and investor. Ken is the...

Dr. Bryan Taylor
Dr. Bryan Taylor President & Chief Economist, Global Financial Data Dr. Bryan Taylor serves as President and Chief Economist for Global Financial Data. He received his B.A. from Rhodes College, his M.A. from the University of South Carolina in International Relations,...

Michael Carr, CMT
Mike Carr, who holds a Chartered Market Technician (CMT) designation, is a full-time trader and contributing editor for Banyan Hill Publishing, a leading investment newsletter service. He is an instructor at the New York Institute of Finance and a contributor to various...
Introduction to Gann Squares - Presented by Mathew Verdouw at the 2011 Annual Symposium
W. D. Gann was a legendary Wall Street trader in the early 1900s. He was a student of the markets and came up with a number of innovative trading strategies. Gann’s legendary status is largely believed to have accelerated after an interview with him was published in the October 1909 issue of Ticker and Investment Digest. Market historians probably already know that the interviewer was Richard D. Wyckoff, another legendary trader.
Wyckoff commented in the article that “It appears to be a fact Mr. W. D. Gann has developed an entirely new idea as to the principles governing stock market movements. He bases his operations upon certain natural laws which, though existing since the world began, have only in recent years been subjected to the will of man and added to the list of so-called modern discoveries.”
One of Gann’s many original ideas was the Gann Square. This is based on his
To view this content you must be an active member of the TAN Association.
Not a member? Join the TAN Association and unlock access to hundreds of hours of written and video technical analysis content, including the Journal of Technical Analysis and the Video Archives. Learn more about Membership here.
Contributor(s)

Mathew Verdouw, CMT, CFTe
Mathew Verdouw, who holds a Chartered Market Technician (CMT) designation, is the CEO and Founder of Optuma, and has been living and breathing Technical Analysis for over 22 years. As a Computer Systems Engineer he wrote his own TA platform, which has been used all over the...
Michael Carr, CMT
Mike Carr, who holds a Chartered Market Technician (CMT) designation, is a full-time trader and contributing editor for Banyan Hill Publishing, a leading investment newsletter service. He is an instructor at the New York Institute of Finance and a contributor to various...
MTA Educational Foundation (MTAEF) Presentation at the Annual Symposium
Bruce Kamich, CMT and I were heartened by the attendance at our presentation about the Educational Foundation at the MTA Annual Symposium. We had a standing-room-only crowd in a Board room of the NYSE and “standing-room-only” is an understatement; the crowd of nearly 60 people barely fit in the room. In attendance were MTA members from New York, from around the US, from London, and even from Iceland. We had advertised our session to be an information meeting about the MTAEF and its educational efforts and needs, so the number of potential volunteers was impressive. Bruce Kamich, President of the MTAEF and Adjunct Professor of technical analysis at Baruch College, conducted the session. Among the other attendees were MTAEF board members Larry Laterza, who teaches TA at Rutgers in New Jersey, Julie Dahlquist, CMT who teaches at the University of Texas in San Antonio, Texas, and myself, an Adjunct Professor
To view this content you must be an active member of the TAN Association.
Not a member? Join the TAN Association and unlock access to hundreds of hours of written and video technical analysis content, including the Journal of Technical Analysis and the Video Archives. Learn more about Membership here.
Contributor(s)

Phil Roth, CMT
Philip J. Roth, who holds the Chartered Market Technician designation, was the Chief Technical Market Analyst at Miller Tabak + Co. from 2001 until April 2012. Phil was a Wall Street professional for 46 years, and has been in the industry for over half a century, having served...
RRG – A New Tool for Visualizing Relative Strength in Global Markets - Presented by Julius de Kempenaer at the 2011 Annual Symposium
Julius began his presentation by highlighting the reality that investing is a process of making choices. The first choice an investor would seem to face is whether to invest or not, however some institutions and funds don’t face this decision. They may have a mandate to be 100% invested in equities at all times. In these cases, they must make the choice to buy and hold the best securities available to them. This is the heart of the investing process, and given a mandate to stay fully invested, the manager will pursue relative returns rather than absolute gains.
Charts help investors decide what to buy or sell, and add to the number of choices investors face. This tool, used by technicians around the world, offers a way to analyze a single security, but charts don’t provide any context or help deciding which security is better. Relative strength is the tool that
To view this content you must be an active member of the TAN Association.
Not a member? Join the TAN Association and unlock access to hundreds of hours of written and video technical analysis content, including the Journal of Technical Analysis and the Video Archives. Learn more about Membership here.
Contributor(s)

Julius de Kempenaer
Julius de Kempenaer, Founder & Director, RRG Research & Sr. Technical Analyst at Stockcharts.com Julius de Kempenaer is the creator of Relative Rotation Graphs®, which have been available on Bloomberg since January 2011 under the mnemonic RRG<GO>. He is the...
Michael Carr, CMT
Mike Carr, who holds a Chartered Market Technician (CMT) designation, is a full-time trader and contributing editor for Banyan Hill Publishing, a leading investment newsletter service. He is an instructor at the New York Institute of Finance and a contributor to various...
Why You Should Care About Market Structure - Presented by Lawrence Leibowitz and Steven Poser at the 2011 Annual Symposium.
Lawrence began this presentation by pointing out that market structure impacts all traders and investors. Direct impacts come from the fact that markets are more fragmented than ever before. There are dozens of venues where trades can be executed, including exchanges, direct access networks, and dark pools. In the very distant past, all trades in listed stocks went through centrally located market makers, but the current environment is much more diverse. Now, there are 13 exchanges, more than 30 automated trading systems, and about 200 broker dealer desks where trades can be executed.
That diversity in where trades can be executed does have advantages for the trader. Lawrence identified several key drivers of changes to market structure. Technology has led to market fragmentation, as orders can now be routed simultaneously across different platforms and the central market maker function is no longer the only way to trade. Regulations imposed by the
To view this content you must be an active member of the TAN Association.
Not a member? Join the TAN Association and unlock access to hundreds of hours of written and video technical analysis content, including the Journal of Technical Analysis and the Video Archives. Learn more about Membership here.
Contributor(s)

Lawrence Leibowitz
Lawrence Leibowitz is the Chief Operating Officer of NYSE Euronext. Steven Poser is Managing Director, Strategic Analysis and Market Data at NYSE

Steve Poser
Steven W. Poser is the Managing Director of Strategic Analysis & Statistics at NYSE Euronext. He is responsible for providing solutions, technical analysis and messaging for NYSE U.S. cash markets business lines, including competitive and market quality analysis. Prior to...
Michael Carr, CMT
Mike Carr, who holds a Chartered Market Technician (CMT) designation, is a full-time trader and contributing editor for Banyan Hill Publishing, a leading investment newsletter service. He is an instructor at the New York Institute of Finance and a contributor to various...
Interview with Kirk Northington
How would you describe your job?
I create advanced analytical tools and methods for technical analysis charting platforms. My methods and tools are primarily based on volatility arithmetic. I build on traditional forms of technical analysis with volatility-based algorithms. These take such forms as volatility-based support and resistance, trend strength, momentum, relative strength, etc. I try to make analysis software which on the surface uses traditionally accepted methodology, but beneath is unconventional.
I also focus on two important aspects of analysis. The first is to increase the objective and decrease the subjective. I like to give tools the ability to deliver absolute readings whenever possible.
Second I develop within a framework of quantitative testing. When I’m done with a particular indicator component, I want to have statistically valid back test data and a performance profile. This gives any user an understanding of the tool’s tendencies, as well as its logical contribution to any
To view this content you must be an active member of the TAN Association.
Not a member? Join the TAN Association and unlock access to hundreds of hours of written and video technical analysis content, including the Journal of Technical Analysis and the Video Archives. Learn more about Membership here.
Contributor(s)

Kirk Northington, CMT
Kirk Northington, who holds a Chartered Market Technician (CMT) designation, is a quantitative technical analyst and the founder of Northington Trading, LLC. He is also the creator of MetaSwing, advanced analytic software for Bloomberg Professional, MetaStock and...
Amber Hestla-Barnhart
Stocks in the Very Long-Term
Technical analysis is often associated with short-term trading. Long-term charts can offer a different perspective.
Few take the time to look at a fifty-year chart of the Dow Jones Industrial Average, which we can see below. You can download a free version of this chart at http://www.srcstockcharts.com/free-dow-jones-charts/. There are several observations that can be made from this chart.
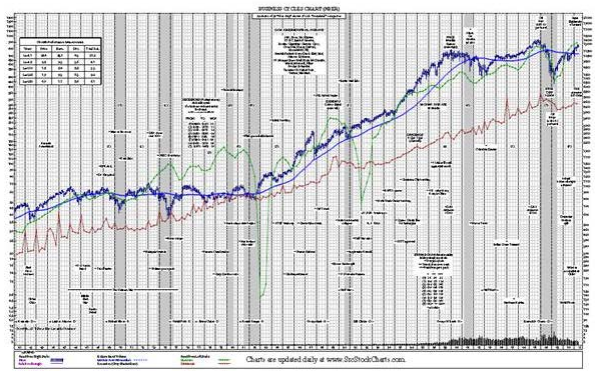 FIFTY YEARS OF THE DOW, DATA FROM SECURITIES RESEARCH COMPANY
Stocks have been largely range-bound since 1999. This marks the twelfth year of a sideways market. This is similar to what investors experienced from 1966 to 1982. After the long bull market that ended in 2000, many forgot that sideways markets are not uneventful. In many ways, the volatility of these two periods has been more challenging than the bull market shown in the
To view this content you must be an active member of the TAN Association.
Not a member? Join the TAN Association and unlock access to hundreds of hours of written and video technical analysis content, including the Journal of Technical Analysis and the Video Archives. Learn more about Membership here.
Contributor(s)
Michael Carr, CMT
Mike Carr, who holds a Chartered Market Technician (CMT) designation, is a full-time trader and contributing editor for Banyan Hill Publishing, a leading investment newsletter service. He is an instructor at the New York Institute of Finance and a contributor to various...
MTA Announcements
MTA Membership Dues Renewal
Approximately 25% of our membership has dues expiring in the months of June and July. It is important that you renew in a timely fashion to ensure there is no disruption in overall MTA services. To renew, simply log into MyMTA and in the middle of
that page you will find a section under “Membership Information” called “My Membership.” There you will find a link to renew your member dues. If you would prefer, you can call the MTA Headquarters at 646-652-3300 and renew over the telephone with any of the MTA Staff members.
MTA.org Launches New Home Page
The MTA launched a new home page design. This new design was created to better highlight some of the more important information that we feel our visitors would like to see when they first
arrive at MTA.org. New features include:
- A dedicated section
To view this content you must be an active member of the TAN Association.
Not a member? Join the TAN Association and unlock access to hundreds of hours of written and video technical analysis content, including the Journal of Technical Analysis and the Video Archives. Learn more about Membership here.
New Educational Content This Month
-
August 26, 2020

The CMT Experience
Presenter(s): Tyler Wood, Dave Lundgren, CMT, CFA
-
August 26, 2020
Reading the Current Market in Light of History’s Lessons
Presenter(s): Ryan Detrick, CMT
-
August 12, 2020
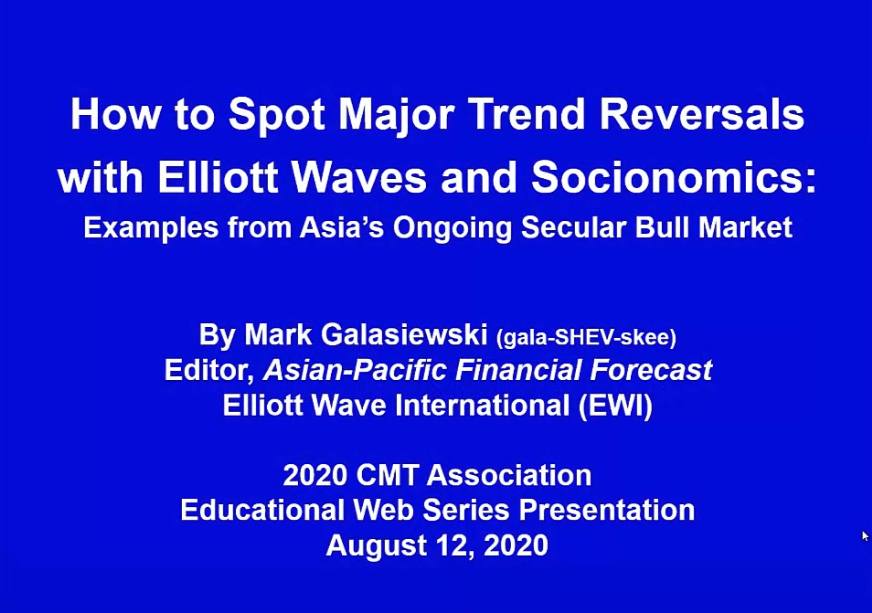
How to Spot Major Trend Reversals with Elliott Waves and Socionomics: Examples from Asia’s Ongoing Secular Bull Market
Presenter(s): Mark Galasiewski