
MTA becomes TAN Association
Beginning July 15th, after nearly 50 years of service to the financial industry, the Market Technicians Association is becoming the TAN Association and updating the organization’s brand. As members of the organization, we cannot thank you for creating this remarkable home for the advancement of technical analysis. Committed volunteers and engaged participants are the reason our discipline has the professional respect we enjoy today. As we strive to uphold the vision of our founders while adapting to the rapidly changing industry, we hope that you will help us extend the reach of the organization by sharing this news with your colleagues, clients, and professional contacts. The Association’s leadership including Board Members, founding members, and senior staff, recommended that members approve changing our organization’s name. Having carefully considered all implications of the legal name change, the leadership felt that it is imperative to rationalize the number of acronyms out in the industry. Pending approval by a vote of the Membership, you’ll see the new look and name anywhere we’re out in public, like our website, publications, digital webcasts, LinkedIn,To view this content you must be an active member of the TAN Association.
Not a member? Join the TAN Association and unlock access to hundreds of hours of written and video technical analysis content, including the Journal of Technical Analysis and the Video Archives. Learn more about Membership here.
What's Inside...
NORTHERN CALIFORNIA MTA CHAPTER MEETING - JUNE 22, 2017, SAN FRANCISCO, CA
Steven Moffitt, PhD presented to an enthusiastic crowd during the meeting of the Northern California MTA chapter at the Le Meridien Hotel located in the heart of the San Francisco financial...
BUYING OUTPERFORMERS IS TOO LATE
by Mathew Verdouw, CMT, CFTeEditor’s note: this paper was originally published in the Research section at Optuma.com. ABSTRACT: We are told two rules in finance: “buy low and sell high” and also “past performance is not...
THINK & TRADE LIKE A CHAMPION: THE SECRETS, RULES & BLUNT TRUTHS OF A STOCK MARKET WIZARD
by Mark Minervini & Michael Carr, CMT“I have always said that trading triggers the same neurological impulses as going into the jungle unarmed and having a tiger rush out at you! The same adrenaline rush, the same pressure, elevated...
“MAYDAY!” CALL FOR EUR/USD?
by Howard Friend, CMTEditor’s note: this analysis was originally prepared on May 1, 2017. Students of market price action, commonly known as market ‘technicians’ or sometimes more confusingly ‘technical...
EASY AND SUCCESSFUL MACROECONOMIC TIMING
by William RafterEditor’s note: This paper was originally published at MathInvest.com and is reprinted with permission. Abstract: When the economy takes a turn for the worse, employment declines, right? Well, not...
THE DIFFERENCE BETWEEN STATISTICS AND STRATEGY
by Charlie Bilello, CMTEditor’s note: this article was originally published in the Pension Partners blog on June 1, 2017 and is reprinted with permission. Statement 1: the average year has between 3 and 4 corrections...
CHART OF THE MONTH
For additional perspective on the average drawdown the following chart is reposted from Pension Partners June Market Webinar. To sign up for Pension Partners’ free newsletter, click...
NORTHERN CALIFORNIA MTA CHAPTER MEETING - JUNE 22, 2017, SAN FRANCISCO, CA

Steven Moffitt, PhD presented to an enthusiastic crowd during the meeting of the Northern California MTA chapter at the Le Meridien Hotel located in the heart of the San Francisco financial district. The meeting began when co-chair of the local chapter, Rick Leonhardt, CMT, provided an update about the MTA along with the recent changes and current growth of the TAN Program. After this overview, another one of the chapter’s co-chairs, Rick Lehman, gave an introduction and bio of the event’s speaker.
Steven D. Moffitt holds a Ph.D. in Statistics, an MA in Mathematics and is currently an Adjunct Professor of Finance in the Stuart School of Business at the Illinois Institute of Technology. He has assisted in the development of an index arbitrage system for one of the largest index arbitrageurs
To view this content you must be an active member of the TAN Association.
Not a member? Join the TAN Association and unlock access to hundreds of hours of written and video technical analysis content, including the Journal of Technical Analysis and the Video Archives. Learn more about Membership here.
BUYING OUTPERFORMERS IS TOO LATE
Editor’s note: this paper was originally published in the Research section at Optuma.com.
ABSTRACT: We are told two rules in finance: “buy low and sell high” and also “past performance is not a guarantee of future returns”. Yet many advisers and investors will recommend the best performing securities based on that very assumption. This paper will show that to maximize returns, there has to be a different way to examine when a security should be bought. We do this by using the Relative Rotation Graphs (RRG) to test if absolute returns can be improved by responding the relative trend performance on the RRG charts. The paper will also explain the basic concepts behind the RRG and give the results from many tests.
INTRODUCTION
It’s a commonly used adage that investors should buy low and sell high. Everyone who is interested in the capital appreciation of their investments is trying to live by that
To view this content you must be an active member of the TAN Association.
Not a member? Join the TAN Association and unlock access to hundreds of hours of written and video technical analysis content, including the Journal of Technical Analysis and the Video Archives. Learn more about Membership here.
Contributor(s)

Mathew Verdouw, CMT, CFTe
Mathew Verdouw, who holds a Chartered Market Technician (CMT) designation, is the CEO and Founder of Optuma, and has been living and breathing Technical Analysis for over 22 years. As a Computer Systems Engineer he wrote his own TA platform, which has been used all over the...
THINK & TRADE LIKE A CHAMPION: THE SECRETS, RULES & BLUNT TRUTHS OF A STOCK MARKET WIZARD
“I have always said that trading triggers the same neurological impulses as going into the jungle unarmed and having a tiger rush out at you! The same adrenaline rush, the same pressure, elevated heart rate, difficulty thinking clearly, etc. That makes the panic even worse, and often at the exact wrong moment. How can a trader manage such a situation and help minimize the emotional hijacking that takes place under stressful trading scenarios?”
That question is at the end of the book and it is completely answered in the pages of this book. This is truly one of the rare books about trading that offers something new.

Mark Minervini has been a trader for nearly 30 years. He is featured in Jack Schwager’s Stock Market Wizards; Conversations with America’s Top Stock Traders. Schwager is an expert on traders and is not easily impressed. He
To view this content you must be an active member of the TAN Association.
Not a member? Join the TAN Association and unlock access to hundreds of hours of written and video technical analysis content, including the Journal of Technical Analysis and the Video Archives. Learn more about Membership here.
Contributor(s)

Mark Minervini
Mark Minervini is a technical analyst, acclaimed author, instructor, and independent trader. He has over 30 years of experience in finance, and was featured in Jack Schwager's Stock Market Wizards; Conversations with America's Top Stock Traders. Schwager wrote: "Minervini's...

Michael Carr, CMT
Mike Carr, who holds a Chartered Market Technician (CMT) designation, is a full-time trader and contributing editor for Banyan Hill Publishing, a leading investment newsletter service. He is an instructor at the New York Institute of Finance and a contributor to various...
“MAYDAY!” CALL FOR EUR/USD?
Editor’s note: this analysis was originally prepared on May 1, 2017.
Students of market price action, commonly known as market ‘technicians’ or sometimes more confusingly ‘technical analysts’, often find themselves by the very nature of their discipline pouring over historical price charts in a detective-like manner looking for clues as to future market direction. Technical theory has it that financial markets tend to move in trends and that those trends can often persist long enough for the technically-based trader to make profit from accurate market timing.
One of the most important tools a technician has at his or her disposal are so called ‘support’ and ‘resistance’ levels. These are inflection points on the price charts where after an advance the price starts to fall leaving behind a high watermark or ‘resistance’ level while a support level is the same thing but in reverse with regards to a market decline. A rising trend
To view this content you must be an active member of the TAN Association.
Not a member? Join the TAN Association and unlock access to hundreds of hours of written and video technical analysis content, including the Journal of Technical Analysis and the Video Archives. Learn more about Membership here.
Contributor(s)

Howard Friend, CMT
Howard Friend, CMT, is a Swiss-based multi-asset class trader with a specialization in the development and trading of systematic chart-based methodologies (‘HF Systems’). Howard is Chief Investment Officer, Easy Neu Alpha Partners SA. He has developed his own trading...
EASY AND SUCCESSFUL MACROECONOMIC TIMING
Editor’s note: This paper was originally published at MathInvest.com and is reprinted with permission.
Abstract: When the economy takes a turn for the worse, employment declines, right? Well, not all employment. Certainly, full-time employment declines during recessions, but concurrently part-time employment rises strongly during economic downturns. An adept fiduciary can contrast the two types of employment, as well as a variety of other data, and get good broad-brush investment timing decisions before an official determination of a Recession. Using the described method enables an investor to seriously reduce drawdowns and greatly improve the reward-to-risk ratio. This works well as a stand-alone improvement to Buy & Hold or as an initial screen prior to other fundamental or technical analysis. Decisions can be made monthly, weekly or even daily for those willing to do a bit more work.
What are the implications of recessions on investments?
A good rule for investment success is to avoid
To view this content you must be an active member of the TAN Association.
Not a member? Join the TAN Association and unlock access to hundreds of hours of written and video technical analysis content, including the Journal of Technical Analysis and the Video Archives. Learn more about Membership here.
Contributor(s)
William Rafter
William Rafter is president of MathInvest. He has managed hedge funds for over 30 years. Mr. Rafter was educated at the Wharton School of the University of Pennsylvania, and the Haas Graduate School of Business Administration of the University of California, Berkeley. He can be...
THE DIFFERENCE BETWEEN STATISTICS AND STRATEGY
Editor’s note: this article was originally published in the Pension Partners blog on June 1, 2017 and is reprinted with permission.
Statement 1: the average year has between 3 and 4 corrections greater than 5%.
Statement 2: every year has between 3 and 4 corrections greater than 5%.
Statement 1 is a true statistic regarding the S&P 500 going back to 1928. It can serve as a helpful reminder that there is no reward without risk and that equity securities are inherently volatile (the current period notwithstanding). Corrections happen, even in good markets.
Problems start to arise when investors assume that because Statement 1 is true that Statement 2 must be true as well. Markets, unfortunately, don’t operate that way. The actual environment rarely looks like the average environment.
Since March 2009, there have been 21 corrections greater than 5%, but they were not evenly distributed. In 2009 and 2010, we saw 4. In 2013
To view this content you must be an active member of the TAN Association.
Not a member? Join the TAN Association and unlock access to hundreds of hours of written and video technical analysis content, including the Journal of Technical Analysis and the Video Archives. Learn more about Membership here.
Contributor(s)

Charlie Bilello, CMT
Charlie Bilello, who holds the Chartered Market Technician (CMT) designation, is the Director of Research at Pension Partners, LLC, where he is responsible for strategy development, investment research and communicating the firm’s investment themes and portfolio positioning to...
CHART OF THE MONTH
For additional perspective on the average drawdown the following chart is reposted from Pension Partners June Market Webinar.
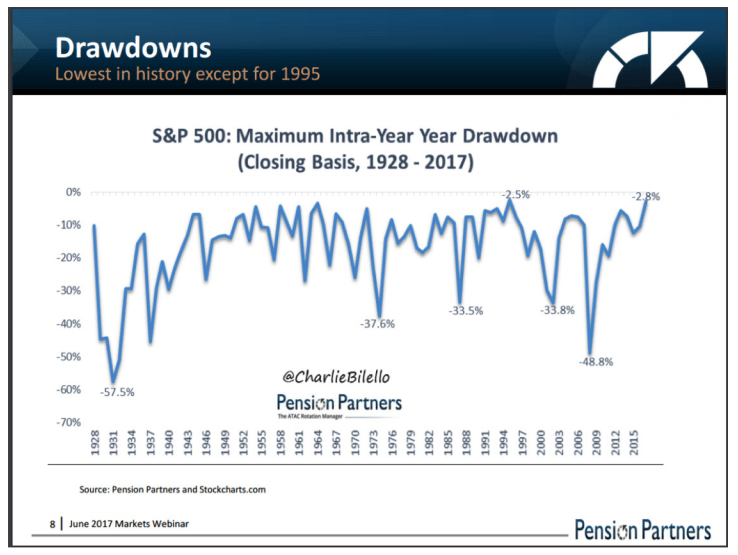
To sign up for Pension Partners’ free newsletter, click here.
To view this content you must be an active member of the TAN Association.
Not a member? Join the TAN Association and unlock access to hundreds of hours of written and video technical analysis content, including the Journal of Technical Analysis and the Video Archives. Learn more about Membership here.
New Educational Content This Month
-
August 26, 2020

The CMT Experience
Presenter(s): Tyler Wood, Dave Lundgren, CMT, CFA
-
August 26, 2020
Reading the Current Market in Light of History’s Lessons
Presenter(s): Ryan Detrick, CMT
-
August 12, 2020
How to Spot Major Trend Reversals with Elliott Waves and Socionomics: Examples from Asia’s Ongoing Secular Bull Market
Presenter(s): Mark Galasiewski