
LETTER FROM THE EDITOR
This month’s issue of Technically Speaking offers some of the theory underlying technical analysis and several examples of how this theory is applied. The applications are specific and although diverse, charts are central to each. Although many of us have a number of quantitative tools at our disposal, price charts remain an indispensible part of technical analysis. For that reason, a number of charts are shown.
Jay Lefkowicz, CFA, CMT, uses long-term charts to make a bullish argument for U.S. stocks. Aksel Kibar, CMT, offers insights into some markets U.S.-based analysts may overlook. Nishant Bali ties together principles of market sentiment and intermarket analysis to build the bearish case for U.S. stocks. Each analysis is unique but well-structured and persuasive.
We would like the opportunity to include the work of other MTA members in future issues of Technically Speaking. If you publish research on a regular basis, please consider adding editor@mta.org to your distribution list.
Michael Carr
The applications are specific and although diverse, charts are central to each. Although many of us have a number of quantitative tools at our disposal, price charts remain an indispensible part of technical analysis. For that reason, a number of charts are shown.
Jay Lefkowicz, CFA, CMT, uses long-term charts to make a bullish argument for U.S. stocks. Aksel Kibar, CMT, offers insights into some markets U.S.-based analysts may overlook. Nishant Bali ties together principles of market sentiment and intermarket analysis to build the bearish case for U.S. stocks. Each analysis is unique but well-structured and persuasive.
We would like the opportunity to include the work of other MTA members in future issues of Technically Speaking. If you publish research on a regular basis, please consider adding editor@mta.org to your distribution list.
Michael Carr
To view this content you must be an active member of the TAN Association.
Not a member? Join the TAN Association and unlock access to hundreds of hours of written and video technical analysis content, including the Journal of Technical Analysis and the Video Archives. Learn more about Membership here.
What's Inside...
DO INDICATORS REALLY WORK AS ADVERTISED?
by Michael Carr, CMTMarket professionals understand that you can’t find success using standard technical indicators with the default settings. RSI, Welles Wilder’s Relative Strength Index, is a popular indicator but...
S&P 500 INDEX: TO INFINITY AND BEYOND? NO, “JUST” 2584
by Jay Lefkowicz, CFA, CMTEditor’s note: This report was originally published by Concept Capital Markets, LLC, and is republished here with permission. On May 10th, S&P 500 Index (SPX) confirmed the breakout above a...
TECH TALK: TREASURY & CAPITAL MARKETS
by Aksel Kibar, CMTEditor’s note: Tech Talk originally published as a research report by the Abu Dhabi Investment Company, which operates under the trading name of Invest AD. It is reprinted here with...
WHY TECHNICAL ANALYSIS WORKS
by Michael Carr, CMTThere are three simple precepts defined by John Murphy in Technical Analysis of the Financial Markets: Market action discounts everything. Prices move in trends. History repeats itself. The...
THE END IS NOT FAR OFF
by Nishant Bali, MBA, CeTAAfter analyzing major sentiment tools, intermarket principles and Elliott Wave, we reach the conclusion that the end of the bull market is not too far in the future. In this article, we show that a...
INTERVIEW WITH J.C. PARETS, CMT
by JC Parets, CMT & Amber Hestla-BarnhartWhat led you to look at the particular markets you specialize in? When I was a junior at Fairfield University I interned at Merrill Lynch, in the wealth management department. At a very young age I...
MEMBER PROFILE: DEREK HERNQUIST, CMT
by Amber Hestla-BarnhartDerek Hernquist is a Portfolio Manager at D. Scott Neal, Inc., where he focuses exclusively on implementing an ETF-based Tactical Asset Allocation program for the firm’s investment clients. He...
WRESTLING, MICHAEL JORDAN, AND LOSING TRADES
by Glen LarsonEditor’s note: This article was originally published at Trade Ticker by Trade Navigator and is reprinted here with permission. I recently attended a high school wrestling match to support a...
DO INDICATORS REALLY WORK AS ADVERTISED?
Market professionals understand that you can’t find success using standard technical indicators with the default settings. RSI, Welles Wilder’s Relative Strength Index, is a popular indicator but traders applying this tool exactly as Wilder described in his original work will be disappointed.
RSI is designed to highlight periods of time when the market action reaches an extreme. The value of RSI can range from 0 to 100 although readings below 15 or above 90 are rare. Wilder suggested using 30 as a level to define oversold markets and 70 to define overbought markets.
The indicator is calculated with a default setting of 14 days but uses exponential moving averages in Wilder’s formulation which means no data is ever completely excluded from the calculation. With simple testing, we can determine if 14 days is a useful value to use when calculating RSI.
Testing buy signals when RSI falls below 30 shows that this indicator
To view this content you must be an active member of the TAN Association.
Not a member? Join the TAN Association and unlock access to hundreds of hours of written and video technical analysis content, including the Journal of Technical Analysis and the Video Archives. Learn more about Membership here.
Contributor(s)

Michael Carr, CMT
Mike Carr, who holds a Chartered Market Technician (CMT) designation, is a full-time trader and contributing editor for Banyan Hill Publishing, a leading investment newsletter service. He is an instructor at the New York Institute of Finance and a contributor to various...
S&P 500 INDEX: TO INFINITY AND BEYOND? NO, “JUST” 2584
Editor’s note: This report was originally published by Concept Capital Markets, LLC, and is republished here with permission.
On May 10th, S&P 500 Index (SPX) confirmed the breakout above a 13-year ascending triangle pattern in the weekly chart that projects to about 2588.
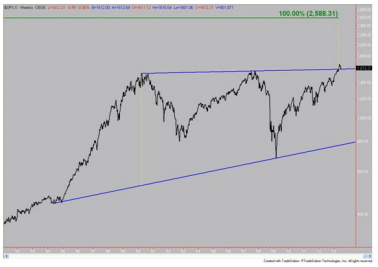 Source: Created with TradeStation. © TradeStation Technologies, Inc. All rights reserved
On May 31st, SPX confirmed the breakout above in the monthly chart that projects to about 2536.
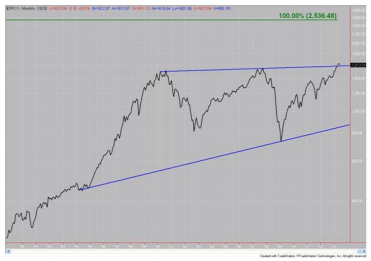 Source: Created with TradeStation. © TradeStation Technologies, Inc. All rights reserved
Since the monthly chart breakout validates the weekly chart breakout, our upside expectation becomes 2584 with an 8-year time horizon. That ties everything together with a nice, neat Fibonacci bow.
Based
To view this content you must be an active member of the TAN Association.
Not a member? Join the TAN Association and unlock access to hundreds of hours of written and video technical analysis content, including the Journal of Technical Analysis and the Video Archives. Learn more about Membership here.
Contributor(s)

Jay Lefkowicz, CFA, CMT
Jay Lefkowicz, CFA, CMT, Technical Strategist at Concept Capital Markets, LLC (CCM), began his finance career in 1988 with the fixed-income analytics department at Merrill Lynch & Co. After joining Instinet in 1992, he focused his attention on the area of stock market...
TECH TALK: TREASURY & CAPITAL MARKETS
Editor’s note: Tech Talk originally published as a research report by the Abu Dhabi Investment Company, which operates under the trading name of Invest AD. It is reprinted here with permission.
Gold breaks below $1,330 levels
Following U.S. Federal Reserve Chairman Ben Bernanke’s press conference that mapped out a timetable for ending quantitative easing in 2014, markets experienced a sharp sell-off. Yields rebounded, equities sold-off and metals resumed their downtrend. In April, Gold price broke down below $1,525 level to reach $1,330 levels and the metal has since been consolidating between $1,500 and $1,330. The beneficiaries of quantitative easing have been precious metals and reversing this resulted in further weakness. Gold broke down the previous three-month consolidation and reached 1,270 levels. Price fell below April’s low levels, which will now become a resistance at $1,325; price should move above this level for the technical outlook to improve. Unless price recovers above $1,325,
To view this content you must be an active member of the TAN Association.
Not a member? Join the TAN Association and unlock access to hundreds of hours of written and video technical analysis content, including the Journal of Technical Analysis and the Video Archives. Learn more about Membership here.
Contributor(s)

Aksel Kibar, CMT
Aksel Kibar, who holds the Chartered Market Technician (CMT) designation, is currently the managing director of his investment company, Tech Charts LLC. Mr. Kibar began his career in finance in 2001 as an Assistant Technical Analyst at Yapi Kredi Bank. After 4 years of...
WHY TECHNICAL ANALYSIS WORKS
There are three simple precepts defined by John Murphy in Technical Analysis of the Financial Markets:
- Market action discounts everything.
- Prices move in trends.
- History repeats itself.
The trending behavior of prices is one of the reasons that technical analysis can help analysts beat the markets in the long run. While technicians know this is true based on their experience, it can be difficult to demonstrate this without using advanced and confusing mathematical principles. While there is no substitute for the math, it can be helpful to look at the distributions of returns to see how trends develop over time.
The charts below show the returns over rolling one-year periods, rolling one-month periods and one day. Data from January 2001 through June 2013 is used. Over that time span, there are 2,885 rolling one-year time periods; 3,116 one-month periods; and 3,136 days. SPDR S&P 500 (NYSE: SPY) has provided buy and hold investors with a compound
To view this content you must be an active member of the TAN Association.
Not a member? Join the TAN Association and unlock access to hundreds of hours of written and video technical analysis content, including the Journal of Technical Analysis and the Video Archives. Learn more about Membership here.
Contributor(s)
Michael Carr, CMT
Mike Carr, who holds a Chartered Market Technician (CMT) designation, is a full-time trader and contributing editor for Banyan Hill Publishing, a leading investment newsletter service. He is an instructor at the New York Institute of Finance and a contributor to various...
THE END IS NOT FAR OFF
After analyzing major sentiment tools, intermarket principles and Elliott Wave, we reach the conclusion that the end of the bull market is not too far in the future. In this article, we show that a variety of indicators are showing an extreme level of optimism but the most important indicators are associated with “timing the market” and these are bearish as well.
Our advice for the medium to long term is summed up as “sell the dollar; sell equities; sell the Nikkei; long Japanese yen; long Australian dollars; and long commodities.” Now, we’ll look at the charts that led us to those conclusions.
1. Margin Debt
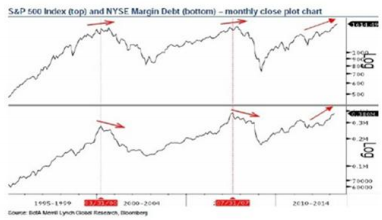
Margin debt levels, and their rate of change, are sometimes used as an indicator of investor sentiment because margin debt rises when investors feel good about the prospects of the
To view this content you must be an active member of the TAN Association.
Not a member? Join the TAN Association and unlock access to hundreds of hours of written and video technical analysis content, including the Journal of Technical Analysis and the Video Archives. Learn more about Membership here.
Contributor(s)

Nishant Bali, MBA, CeTA
Nishant Bali, MBA, CeTA is a Senior Technical Strategist, Currency and Commodity Strategy, at Adriot Tradelink pvt ltd in India. He is a member of the Market Technicians Associations (U.S.), World Financial Groups (Canada) and Association of Technical Analysts...
INTERVIEW WITH J.C. PARETS, CMT
What led you to look at the particular markets you specialize in?
When I was a junior at Fairfield University I interned at Merrill Lynch, in the wealth management department. At a very young age I was able to see that the old timers “managing” the portfolios for their high net worth clients were doing very little, if any, managing at all. They would go on golf trips to Europe and take long lunches, all while never talking about the markets. They would just do whatever their analysts told them to do.
They were okay with that, but I wasn’t. I learned very early on that these guys did not know much of anything, other than how to gather assets. It wasn’t about the market; it was about bringing in the next eight-figure account. Wealth management was really wealth gathering. I know this now, but to a 20-year old it can be
To view this content you must be an active member of the TAN Association.
Not a member? Join the TAN Association and unlock access to hundreds of hours of written and video technical analysis content, including the Journal of Technical Analysis and the Video Archives. Learn more about Membership here.
Contributor(s)

JC Parets, CMT
JC Parets, who holds a Chartered Market Technician (CMT) designation, is the founder of All Star Charts and is one of the most widely followed Technical Analysts in the world. All Star Charts is a research platform for both professional and retail investors covering US and...

Amber Hestla-Barnhart
MEMBER PROFILE: DEREK HERNQUIST, CMT
Derek Hernquist is a Portfolio Manager at D. Scott Neal, Inc., where he focuses exclusively on implementing an ETF-based Tactical Asset Allocation program for the firm’s investment clients. He studies price action across multiple time frames in search of sectors and asset classes transitioning from one phase of sentiment to another. Derek believes that big moves start with early clues, and equity markets give us the ability to spot when the underlying components begin to leave those clues for us.
His philosophy was shaped by years spent observing clients, first as a stockbroker and then running a retail trading desk in the late 1990s. These experiences led him to combine behavioral finance with his math background to more objectively measure the collective psychology of the market. The following chart is an oversimplification of his general philosophy but clearly explains the dynamics of supply
To view this content you must be an active member of the TAN Association.
Not a member? Join the TAN Association and unlock access to hundreds of hours of written and video technical analysis content, including the Journal of Technical Analysis and the Video Archives. Learn more about Membership here.
Contributor(s)
Amber Hestla-Barnhart
WRESTLING, MICHAEL JORDAN, AND LOSING TRADES
Editor’s note: This article was originally published at Trade Ticker by Trade Navigator and is reprinted here with permission.
I recently attended a high school wrestling match to support a friend’s son. It brought back memories of when I used to wrestle in high school. I had all but forgotten a secret I had learned in wrestling that helped get me to state championships in both tennis and wrestling.
How could wrestling or tennis relate to trading? How do these relate to investing in losing, my trading, and my life? That is what I discuss this month.
Investing in Losing
I was invited to join the high school wrestling team my junior year. I had participated in football but not wrestling. Walking out in the one piece unitards was not my idea of fun. My coach kept telling me how much fun it would be and to, “give it a try.”
At first, all I
To view this content you must be an active member of the TAN Association.
Not a member? Join the TAN Association and unlock access to hundreds of hours of written and video technical analysis content, including the Journal of Technical Analysis and the Video Archives. Learn more about Membership here.
Contributor(s)

Glen Larson
Glen Larson is President, Genesis Financial Technologies, the provider of advanced analysis and trading platform Trade Navigator. To read more from Glen, please visit his blog. Trade Navigator offers data from U.S., Canadian, Australian, Indian, Japanese, and European markets....
CHART OF THE MONTH
CHART PROVIDED BY TRADE NAVIGATOR
To view this content you must be an active member of the TAN Association.
Not a member? Join the TAN Association and unlock access to hundreds of hours of written and video technical analysis content, including the Journal of Technical Analysis and the Video Archives. Learn more about Membership here.
New Educational Content This Month
-
August 26, 2020

The CMT Experience
Presenter(s): Tyler Wood, Dave Lundgren, CMT, CFA
-
August 26, 2020
Reading the Current Market in Light of History’s Lessons
Presenter(s): Ryan Detrick, CMT
-
August 12, 2020
How to Spot Major Trend Reversals with Elliott Waves and Socionomics: Examples from Asia’s Ongoing Secular Bull Market
Presenter(s): Mark Galasiewski