To view this content you must be an active member of the TAN Association.
Not a member? Join the TAN Association and unlock access to hundreds of hours of written and video technical analysis content, including the Journal of Technical Analysis and the Video Archives. Learn more about Membership here.
What's Inside...
2016 FALL FINANCIAL MARKET OUTLOOK
by Pring Turner Capital GroupEditor’s note: this article was originally published by Pring Turner Capital Group on October 5, 2016. Opinions and data are current as of then. It is republished here with...
2016 YEAR IN REVIEW - COMMODITIES
by Greg Schnell, CMT, MFTAEditor’s note: This was originally published at StockCharts.com. Additional 2016 Year in Review articles addressing different markets were also published and can be viewed by clicking the market...
TWO ROADS: 1 TO N, 0 TO 1
by Charlie Bilello, CMT“Doing what we already know how to do takes the world from 1 to n, adding more of something familiar. But every time we create something new, we go from 0 to 1. The act of creation is...
FUNDAMENTAL LINE INDICATORS FOR INVESTORS
by Martha Stokes, CMTEditor’s note: this article was originally published by Proactive Advisor Magazine and is republished here with permission. To learn more about Proactive Advisor Magazine, click here. Subscriptions...
THE POWER OF AVOIDING MISTAKES
by Stephen DuneierEditor’s note: This article was originally published at Bija Advisors. The author presented a webinar for MTA members, Better Decisions, Better Results: Using Cognitive Science to Gain a...
MARKETS ARE TOO COMPLACENT ABOUT CHINA’S CURRENCY SLIDE
by Global Income Team, Eaton VanceEditor’s note: this was originally posted at Harvest Exchange, a research site for investment professionals. To learn more, click here. Investors began the year concerned that overvalued Chinese...
CALL FOR NOMINATIONS
The Market Technicians Association (MTA) is a dynamic association focused on building a strong community of market professionals, maintaining the highest ethical standards in the industry, and...
YIELD-HUNGRY INVESTORS EXPLORE CBOE’S OPTION-SELLING BENCHMARKS DURING BOND MARKET “ROUT”
by Matthew MoranEditor’s note: this article was originally published at CBOE Options Hub. Here are some highlights from recent news stories on the bond markets: A Wall Street Journal story had the...
CHART OF THE MONTH
by Greg Schnell, CMT, MFTAEach of the following charts contains three components. The Index in the top panel The Bullish Percent Index in the second panel The % of stocks above the long term 200 day average in the...
2016 FALL FINANCIAL MARKET OUTLOOK
Editor’s note: this article was originally published by Pring Turner Capital Group on October 5, 2016. Opinions and data are current as of then. It is republished here with permission.
Summary
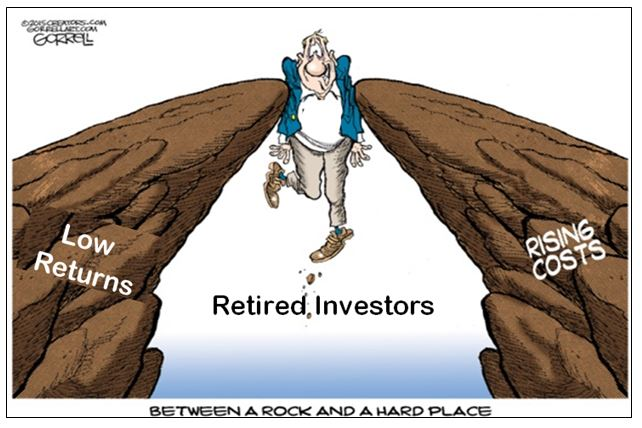
This update focused on the challenges facing investors. Retired investors are especially challenged to both protect and grow their portfolios in today’s low return world. We started by highlighting the dual challenges of high stock market valuations coupled with record low interest rates. The current starting point today of near record high equity valuations points to low future investment returns. Investors and savers are also challenged by the fact yields have never in America’s 240-year history been as low as they are currently!
Martin Pring shared his analysis of the economy and financial markets. He likened the economy to an auto
To view this content you must be an active member of the TAN Association.
Not a member? Join the TAN Association and unlock access to hundreds of hours of written and video technical analysis content, including the Journal of Technical Analysis and the Video Archives. Learn more about Membership here.
Contributor(s)

Pring Turner Capital Group
Pring Turner is an Investment Advisor in Walnut Creek, California. The firm serves the Walnut Creek, Danville, Alamo, Pleasanton, Orinda, Lafayette, Moraga, Pleasant Hill, and broader San Francisco Bay Area. Since 1977, the firm has specialized in providing personalized...
2016 YEAR IN REVIEW - COMMODITIES
Editor’s note: This was originally published at StockCharts.com. Additional 2016 Year in Review articles addressing different markets were also published and can be viewed by clicking the market name, Equities, Currencies, Bonds.
When we look back on 2016, we can add a few tips to our trading journals. Lots of key moments created great buying opportunities. After years of commodities being routed, it was a year for commodities to create fantastic returns. While many Main Stream Media channels focus on the commodities, the majority of the moves happen in the companies related to the commodities.
From the two sectors (Materials and Energy) that generated some phenomenal individual company returns, it is worth looking back to add tips into our trading journal for future use.
Here is the stellar chart showing how ETF’s that average the companies in the industry group moved. Key Commodity Producer ETF’s. Junior Gold Miners were up 160% on average by August! More ‘Senior’ Gold
To view this content you must be an active member of the TAN Association.
Not a member? Join the TAN Association and unlock access to hundreds of hours of written and video technical analysis content, including the Journal of Technical Analysis and the Video Archives. Learn more about Membership here.
Contributor(s)

Greg Schnell, CMT, MFTA
Greg A. Schnell, CMT, MFTA is a Senior Technical Analyst at StockCharts.com, specializing in intermarket and commodities analysis. Greg joined StockCharts in 2012 and has been instrumental in helping launch a variety of new blogs and other commentary platforms. Based in Calgary,...
TWO ROADS: 1 TO N, 0 TO 1
“Doing what we already know how to do takes the world from 1 to n, adding more of something familiar. But every time we create something new, we go from 0 to 1. The act of creation is singular, as is the moment of creation, and the result is something fresh and strange.” – Peter Thiel, Zero to One
Two roads diverged: one takes you from 1 to n and the other from 0 to 1.
On which path is the asset management industry headed?
If we’re being honest, the answer is clear. It’s on the road from 1 to n and has been for some time now. Technology and intense competition are driving down fees at an accelerating pace. There is no sign of this trend abating anytime soon and no economic rationale why it should. If this continues, we will eventually reach a state of “perfect competition,” where in the long run no company
To view this content you must be an active member of the TAN Association.
Not a member? Join the TAN Association and unlock access to hundreds of hours of written and video technical analysis content, including the Journal of Technical Analysis and the Video Archives. Learn more about Membership here.
Contributor(s)

Charlie Bilello, CMT
Charlie Bilello, who holds the Chartered Market Technician (CMT) designation, is the Director of Research at Pension Partners, LLC, where he is responsible for strategy development, investment research and communicating the firm’s investment themes and portfolio positioning to...
FUNDAMENTAL LINE INDICATORS FOR INVESTORS
Editor’s note: this article was originally published by Proactive Advisor Magazine and is republished here with permission. To learn more about Proactive Advisor Magazine, click here. Subscriptions are free for financial professionals.
Fundamental analysis is the foundation of stock investing and continues to be the number one source of data for selecting stocks by giant institutions, market professionals, managers of small funds, and retail investors. However, the quality of fundamental data and the timeliness of that data are not the same for each of these market participant groups.
The retail investor often receives data from financial reports after the information has already been acquired by institutions and market professionals.
Major institutions—responsible for the largest mutual and pension funds—have the resources, talent, and power to investigate companies well ahead of any reports issued by a firm to the general public. Though it may appear that technical patterns lead or predict the market,
To view this content you must be an active member of the TAN Association.
Not a member? Join the TAN Association and unlock access to hundreds of hours of written and video technical analysis content, including the Journal of Technical Analysis and the Video Archives. Learn more about Membership here.
Contributor(s)

Martha Stokes, CMT
Martha Stokes, who holds a Chartered Market Technician (CMT) designation, is the Co-founder and CEO of TechniTrader. She is a former buy-side Technical Analyst. Since 1998, she has developed over 40 TechniTrader Stock and Option courses and classes for beginning to advanced...
THE POWER OF AVOIDING MISTAKES
Editor’s note: This article was originally published at Bija Advisors. The author presented a webinar for MTA members, Better Decisions, Better Results: Using Cognitive Science to Gain a Competitive Edge, which can be viewed here.
Since 2000, Bill Belichick is far and away the most successful coach in the NFL. Having won slightly more than 80% of their last 200 regular season games, his team, the New England Patriots are head and shoulders above the competition. They are the reigning Super Bowl champs for a fourth time under his leadership, have won 22 playoff games and are on track to easily win their division again this season. The results speak for themselves, but when compared against the other 31 coaches in the league they are simply astounding (see chart below).
In fact, his record is so spectacular that many have resorted to accusations of cheating, seeing no other way to
To view this content you must be an active member of the TAN Association.
Not a member? Join the TAN Association and unlock access to hundreds of hours of written and video technical analysis content, including the Journal of Technical Analysis and the Video Archives. Learn more about Membership here.
Contributor(s)

Stephen Duneier
Stephen Duneier is the founder and CEO of Bija Advisors, an investment strategy coaching group. For nearly thirty years, he has applied cognitive science to investment management. The result has been the turnaround of numerous institutional trading businesses, career...
MARKETS ARE TOO COMPLACENT ABOUT CHINA’S CURRENCY SLIDE
Editor’s note: this was originally posted at Harvest Exchange, a research site for investment professionals. To learn more, click here.
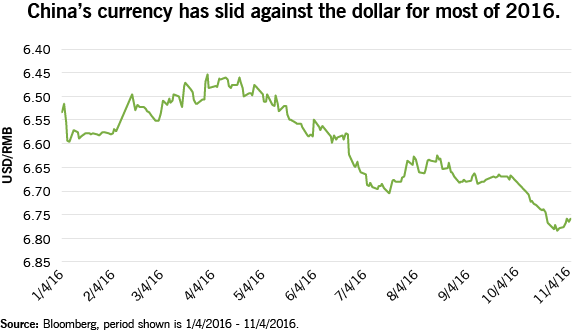
Investors began the year concerned that overvalued Chinese markets posed a threat to financial stability, evidenced by capital outflows that drove a 5% slide of the Chinese yuan (the RMB) against the U.S. dollar in the three months ending January 31.
But even though the RMB slid another 5% against the dollar since March, the weakening currency is no longer viewed with concern.
Several factors are behind this turnaround:
- Capital account tightening: Restrictions imposed by the Chinese to prevent money freely leaving the country helped restore confidence in policymakers.
- Economic stimulus: The Chinese economy is better off than at the start of the year, helped by stimulus and re-leveraging of various parts
To view this content you must be an active member of the TAN Association.
Not a member? Join the TAN Association and unlock access to hundreds of hours of written and video technical analysis content, including the Journal of Technical Analysis and the Video Archives. Learn more about Membership here.
Contributor(s)

Global Income Team, Eaton Vance
CALL FOR NOMINATIONS
The Market Technicians Association (MTA) is a dynamic association focused on building a strong community of market professionals, maintaining the highest ethical standards in the industry, and promoting the use of technical analysis in the investment process. Participating in the leadership of an organization like the MTA can be a deeply rewarding experience. It is an opportunity to work closely with industry leaders, to significantly further the mission of the MTA, and to have a real impact on technical analysis in the financial industry. You will also find the experience to provide great opportunities to improve yourself both personally and professionally.
So what is actually involved in serving on the MTA Board? What qualities should you look for when nominating other members? Is this a good role for you personally? Here are the expectations of MTA Board members, which I have boiled down to the “5 P’s.” An MTA Board member
To view this content you must be an active member of the TAN Association.
Not a member? Join the TAN Association and unlock access to hundreds of hours of written and video technical analysis content, including the Journal of Technical Analysis and the Video Archives. Learn more about Membership here.
YIELD-HUNGRY INVESTORS EXPLORE CBOE’S OPTION-SELLING BENCHMARKS DURING BOND MARKET “ROUT”
Editor’s note: this article was originally published at CBOE Options Hub.
Here are some highlights from recent news stories on the bond markets:
- A Wall Street Journal story had the headline “Government Bond Rout Deepens on Trump’s Economic Plans,”
- A Barron’s story noted that Jeffrey Gundlach, CEO of DoubleLine Capital, sees “a rise in bond yields that could lift the yield on the 10-year Treasury note to 6% in the next four or five years.”
- A New York Times story stated that “From Indonesia to the United States, government bonds are undergoing a sharp sell-off as investors — large sovereign wealth funds and hedge funds, as well as the accounts of American retirees — restructure investment portfolios to try to capture the fruits of what they expect will be a free-spending Trump presidency.”
- A CNBC headline – “’Trump Thump’ Whacks Bond Market for $1 Trillion Loss.”
I recently spoke with several investors and advisors who are interested in yield-oriented
To view this content you must be an active member of the TAN Association.
Not a member? Join the TAN Association and unlock access to hundreds of hours of written and video technical analysis content, including the Journal of Technical Analysis and the Video Archives. Learn more about Membership here.
Contributor(s)

Matthew Moran
Matthew Moran is a Vice President of Business Development and Head of Global Benchmark Indexes Advancement for the Chicago Board Options Exchange (CBOE), where he is responsible for many of the exchange's educational efforts for pension funds, mutual funds, and other...
CHART OF THE MONTH
Each of the following charts contains three components.
- The Index in the top panel
- The Bullish Percent Index in the second panel
- The % of stocks above the long term 200 day average in the lower panel
What I find particularly important about these 3 as a group is they help you stay long the market while everything is working. However, when they start to disagree, it is time to be aware of the potential for change.
The Bullish Percent Index has been calculated by StockCharts.com as one of the early indicators of breadth based on Point And Figure charts. This index calculates the % of stocks on a buy signal. On a PnF chart, you are either on a buy signal or a sell signal, but the distance between the two levels can be significant. If the market has made a recent high, it is bullish until it makes a lower low. Then it goes on
To view this content you must be an active member of the TAN Association.
Not a member? Join the TAN Association and unlock access to hundreds of hours of written and video technical analysis content, including the Journal of Technical Analysis and the Video Archives. Learn more about Membership here.
Contributor(s)
Greg Schnell, CMT, MFTA
Greg A. Schnell, CMT, MFTA is a Senior Technical Analyst at StockCharts.com, specializing in intermarket and commodities analysis. Greg joined StockCharts in 2012 and has been instrumental in helping launch a variety of new blogs and other commentary platforms. Based in Calgary,...
New Educational Content This Month
-
August 26, 2020

The CMT Experience
Presenter(s): Tyler Wood, Dave Lundgren, CMT, CFA
-
August 26, 2020
Reading the Current Market in Light of History’s Lessons
Presenter(s): Ryan Detrick, CMT
-
August 12, 2020
How to Spot Major Trend Reversals with Elliott Waves and Socionomics: Examples from Asia’s Ongoing Secular Bull Market
Presenter(s): Mark Galasiewski