
To view this content you must be an active member of the TAN Association.
Not a member? Join the TAN Association and unlock access to hundreds of hours of written and video technical analysis content, including the Journal of Technical Analysis and the Video Archives. Learn more about Membership here.
What's Inside...
TREND FOLLOWING WORKS!
by CMG CAPITAL MANAGEMENT GROUP, INC.This paper is part of CMG’s Investor Education Series and it summarizes the reasons why trend following may be an effective investment strategy. The paper cites a wide range of academic...
EXCERPT FROM ‘HIGHER PROBABILITY COMMODITY TRADING’
by Carley GarnerEditor’s note: the following may be useful as a review For TAN candidates. CHAPTER 13: SPECULATING IN VIX FUTURES ISN’T FOR EVERYBODY In a Trader’s First Book on Commodities, the focus was to...
STALL SPEED AND THE S&P
by David Keller, CMTEditor’s note: this article was originally published on January 18, 2017 at Dave’s Observations and is republished with permission. As a student pilot, one of the most challenging moments early...
WHY PLAY THE BLOOMBERG TRADEBOOK TRADER BRAIN EXERCISE, AN EXERCISE BASED ON THE WORK OF DENISE SHULL, MA?
by Denise Shull, MAEditor’s note: this article was originally published at TheReThinkGroup.net and is reprinted here with permission. Recently, Bloomberg Tradebook released the Trader Brain Exercise. Developed...
THE UPSIDE BREAKOUT CONFIRMS THE BULL MARKET, NOT WITHSTANDING CORRECTIVE ACTION
by David Tippin, PhD & Ron MeiselsJanuary was the month that the bull market treated itself to a “new all-time high party” in New York. The S&P 500, Dow Industrials and Transports, the NASDAQ, the NYSE Composite and the NYSE...
BITCOIN CRASHES TO A NEW HIGH
by Charlie MorrisEditor’s note: This was originally published at AtlasPulse.com. The price action since the middle of December isn’t something bitcoin traders will forget anytime soon. On the Wednesday before...
CBOE SKEW INDEX TOPS 140 TWO DAYS IN A ROW, AS DEMAND FOR DISASTER PROTECTION INCREASES
by Matthew MoranEditor’s note: this was originally published at the CBOE Blog on January 20, 2017 and is reprinted here as an example of how to less well known risk management too. Introduction to CBOE SKEW Index...
THE GLOBAL MACRO EDGE: MAXIMIZING RETURN PER UNIT-OF-RISK BY JOHN NETTO
by Michael Carr, CMTEveryone knows certain things about investing. We all know large returns require accepting larger than average risk. We also know emotions are the enemy of returns and allowing emotions to drive...
FOREIGN EXCHANGE – LONG SEK
by Neil AzousEditor’s note: This was originally published in Sight Beyond Sight on Januray 2, 2017 and is reprinted here with permission as an example of actionable macro-analysis. . To learn...
RELATIONSHIP INVESTING: STOCK MARKET THERAPY FOR YOUR MONEY BY JEFFREY WEISS, CMT
by Michael Carr, CMTIn Relationship Investing: Stock Market Therapy for Your Money, Jeffrey S. Weiss, CMT, takes a nontechnical look at technical analysis. He explains the stock market in terms usually used to...
DO STOCKS OUTPERFORM TREASURY BILLS?
by Hendrik BessembinderEditor’s note: This is a brief extract of a research paper that can be downloaded from SSRN.com. Abstract: Most common stocks do not outperform Treasury Bills. Fifty eight percent of common stocks...
TREND FOLLOWING WORKS!
This paper is part of CMG’s Investor Education Series and it summarizes the reasons why trend following may be an effective investment strategy. The paper cites a wide range of academic research that supports the strategy. It was originally published at cgmwealth.com.
A January 2016 investment study found that trend following is one of just a few investment factors that works consistently over time. Academics call it “time-series momentum,” but the investment approach is most commonly known as “trend following.”
In The Enduring Effect of Time-Series Momentum on Stock Returns Over Nearly 100-Years, by Ian D’Souza, Voraphat Srichanachaichok, George Wang and Chelsea Yaqiong Yao, the authors found trend following to be consistently profitable in different time periods. The research looked at the period from 1927 through 2014. The authors concluded that trend following works in all markets, large and small, everywhere. They believe investor behavioral tendencies to be the primary driver.
They
To view this content you must be an active member of the TAN Association.
Not a member? Join the TAN Association and unlock access to hundreds of hours of written and video technical analysis content, including the Journal of Technical Analysis and the Video Archives. Learn more about Membership here.
Contributor(s)

CMG CAPITAL MANAGEMENT GROUP, INC.
CMG Capital Management Group, Inc. is committed to investor education. Follow their blog, sign up for newsletters, and download White Papers at
EXCERPT FROM ‘HIGHER PROBABILITY COMMODITY TRADING’
Editor’s note: the following may be useful as a review For TAN candidates.
CHAPTER 13: SPECULATING IN VIX FUTURES ISN’T FOR EVERYBODY
 In a Trader’s First Book on Commodities, the focus was to teach readers all they needed to know about the commodity markets before considering market strategy. I went into detail about each of the popular commodity markets and guided traders on how to calculate profit, loss, and risk, in each commodity market. However, a market that regrettably wasn’t discussed but has quickly become a popular topic in the trading community is the Chicago Board of Options Exchange (CBOE) listed volatility index, more commonly known as the VIX. Because of its exclusion from other books I’ve written, and the fact that I receive countless inquiries from my brokerage clients about trading
To view this content you must be an active member of the TAN Association.
Not a member? Join the TAN Association and unlock access to hundreds of hours of written and video technical analysis content, including the Journal of Technical Analysis and the Video Archives. Learn more about Membership here.
Contributor(s)

Carley Garner
Carley Garner is the Senior Commodity Strategist for DeCarley Trading, a division of Zaner, where she also works as a commodity broker. She has written multiple books on futures and options trading, the latest is titled Higher Probability Commodity Trading. Garner also...
STALL SPEED AND THE S&P
Editor’s note: this article was originally published on January 18, 2017 at Dave’s Observations and is republished with permission.
 As a student pilot, one of the most challenging moments early on was getting comfortable with stalls. For those of you that are unfamiliar, a stall is when you basically create the conditions where your wings are unable to provide lift and you start going doing straight down fairly quickly. This happens most often during takeoffs and landings, and as you can guess going straight down in either case is not recommended.
The best way to avoid stalls? Go way up in the air and practice them. The goal being that you become familiar with the sounds and sensations of a stall and get comfortable fixing it immediately so it doesn’t become a major
To view this content you must be an active member of the TAN Association.
Not a member? Join the TAN Association and unlock access to hundreds of hours of written and video technical analysis content, including the Journal of Technical Analysis and the Video Archives. Learn more about Membership here.
Contributor(s)

David Keller, CMT
David Keller, CMT is Chief Market Strategist at StockCharts.com, where he helps investors minimize behavioral biases through technical analysis. He is a frequent host on StockCharts TV, and he relates mindfulness techniques to investor decision making in his blog, The Mindful...
WHY PLAY THE BLOOMBERG TRADEBOOK TRADER BRAIN EXERCISE, AN EXERCISE BASED ON THE WORK OF DENISE SHULL, MA?
Editor’s note: this article was originally published at TheReThinkGroup.net and is reprinted here with permission.
Recently, Bloomberg Tradebook released the Trader Brain Exercise. Developed in collaboration with The ReThink Group, the “game” essentially warms up the parts of the brain involved in pattern recognition and prediction. A leading decision neuroscientist had this to say about it.
The Trader Brain Exercise is the first in what promises to become a unique suite of financial training tools that are designed based on solid scientific analysis of trading skill. To use it is akin to performing the proven exercises that enhance a piano player, a diver, a navy seal, or a pilot. Trading desks will be able to train their members into becoming better traders without risking the company’s money. No longer will trading skill need to be considered “innate” or something that can only be learned on the job. It
To view this content you must be an active member of the TAN Association.
Not a member? Join the TAN Association and unlock access to hundreds of hours of written and video technical analysis content, including the Journal of Technical Analysis and the Video Archives. Learn more about Membership here.
Contributor(s)

Denise Shull, MA
Denise Shull, MA, Decision Coach and Performance Architect, leverages her training in psychological science to solve the challenges of mental mistakes, confidence crises and slumps in Olympic athletes and Wall Street traders. Denise is known for her uncanny effectiveness in...
THE UPSIDE BREAKOUT CONFIRMS THE BULL MARKET, NOT WITHSTANDING CORRECTIVE ACTION
January was the month that the bull market treated itself to a “new all-time high party” in New York. The S&P 500, Dow Industrials and Transports, the NASDAQ, the NYSE Composite and the NYSE daily advance/decline line have all made new all-time highs recently. For good measure, London’s FTSE joined the party in mid-month. And Toronto’s S&P/TSX Composite Index came within 11 points of making its own new high. Weekly charts, which provide a good longer-term perspective, remain unreservedly bullish. Major market indices are well above their rising 200-day Moving Averages and most charts show strong patterns of rising highs and rising lows. Individual sectors and stocks continue a pattern of rotational corrections, with new leadership arising as previous leaders take a rest. “Dow 20,000” may have captured the media’s attention, but it is the NASDAQ that is now showing signs of wanting to take the lead in the bullish
To view this content you must be an active member of the TAN Association.
Not a member? Join the TAN Association and unlock access to hundreds of hours of written and video technical analysis content, including the Journal of Technical Analysis and the Video Archives. Learn more about Membership here.
Contributor(s)
David Tippin, PhD
David Tippin, PhD, has been a contributor to Phases & Cycles since 1995. He has over 20 years of stock market experience and provides a monthly Market

Ron Meisels
Ron Meisels is Founder and President of Phases & Cycles Inc. with over 50 years of stock market experience. He specializes in the independent research of Canadian and U.S. securities and market using Behavior Analysis. Institutions ranked him among the top...
BITCOIN CRASHES TO A NEW HIGH
Editor’s note: This was originally published at AtlasPulse.com.
The price action since the middle of December isn’t something bitcoin traders will forget anytime soon. On the Wednesday before Christmas, the price began to accelerate as it broke above $800 on an unsustainable trajectory. The market peaked 15 days later on the morning of Thursday 5th Jan, at just above $1,150. Some say that was a retest of the all-time high back in December 2013. So far, the 30 day moving average hasn’t been breached on a closing basis, and provided you purchased your bitcoins before Christmas, then life hasn’t changed very much at all.
Bitcoin is maturing. We should be grateful that the spike in volatility has gone from 20% to 75% over the past month. In 2013, it went from 30% to 200%. However critical you want to be about this network, there can be no doubt that it is
To view this content you must be an active member of the TAN Association.
Not a member? Join the TAN Association and unlock access to hundreds of hours of written and video technical analysis content, including the Journal of Technical Analysis and the Video Archives. Learn more about Membership here.
Contributor(s)

Charlie Morris
Charlie Morris is the Head of Multi-Asset at Atlantic House Fund Management, and serves as Manager of the Atlantic House Total Return Fund. Prior to joining Atlantic House, he headed the Absolute Return Team at HSBC Global Asset Management which he co-founded in 2002, where he...
CBOE SKEW INDEX TOPS 140 TWO DAYS IN A ROW, AS DEMAND FOR DISASTER PROTECTION INCREASES
Editor’s note: this was originally published at the CBOE Blog on January 20, 2017 and is reprinted here as an example of how to less well known risk management too.
Introduction to CBOE SKEW Index (“SKEW”)
The crash of October 1987 sensitized investors to the potential for stock market crashes and forever changed their view of S&P 500® returns. Investors now realize that S&P 500 tail risk – the risk of outlier returns two or more standard deviations below the mean – is significantly greater than under a lognormal distribution. The CBOE SKEW Index (“SKEW”) is an index derived from the price of S&P 500 tail risk. Similar to VIX®, the price of S&P 500 tail risk is calculated from the prices of S&P 500 out-of-the-money options. SKEW typically ranges from 100 to 150. A SKEW value of 100 means that the perceived distribution of S&P 500 log-returns is normal, and the
To view this content you must be an active member of the TAN Association.
Not a member? Join the TAN Association and unlock access to hundreds of hours of written and video technical analysis content, including the Journal of Technical Analysis and the Video Archives. Learn more about Membership here.
Contributor(s)

Matthew Moran
Matthew Moran is a Vice President of Business Development and Head of Global Benchmark Indexes Advancement for the Chicago Board Options Exchange (CBOE), where he is responsible for many of the exchange's educational efforts for pension funds, mutual funds, and other...
THE GLOBAL MACRO EDGE: MAXIMIZING RETURN PER UNIT-OF-RISK BY JOHN NETTO
Everyone knows certain things about investing. We all know large returns require accepting larger than average risk. We also know emotions are the enemy of returns and allowing emotions to drive decisions will result in large losses. To avoid these problems, we know that diversification will help reduce risk and is the best strategy for most investors because today’s markets are more efficient and offer fewer opportunities than markets of the past.
 In The Global Macro Edge, John Netto explains why each of these widely held beliefs is a myth. Should readers believe him? Netto is committed to letting data drive his decisions. He provides readers with the data to demonstrate he understands the investment process. He used the methods described in the book to generate $3.1 million in profits after starting with
To view this content you must be an active member of the TAN Association.
Not a member? Join the TAN Association and unlock access to hundreds of hours of written and video technical analysis content, including the Journal of Technical Analysis and the Video Archives. Learn more about Membership here.
Contributor(s)

Michael Carr, CMT
Mike Carr, who holds a Chartered Market Technician (CMT) designation, is a full-time trader and contributing editor for Banyan Hill Publishing, a leading investment newsletter service. He is an instructor at the New York Institute of Finance and a contributor to various...
FOREIGN EXCHANGE – LONG SEK
Editor’s note: This was originally published in Sight Beyond Sight on Januray 2, 2017 and is reprinted here with permission as an example of actionable macro-analysis. . To learn more, please visit Sight Beyond Sight.
We are focused on one currency to begin 2017 – the Swedish krona (SEK).
Before the last Riksbank meeting on December 21st, the Finance Minister, Financial Supervisory Authority (FSA), and National Institute of Economic Research (NEIR) all questioned whether the timeframe for reaching the Country’s inflation target should be “relaxed.” Even Parliament is now reviewing the mandate of the Riksbank.
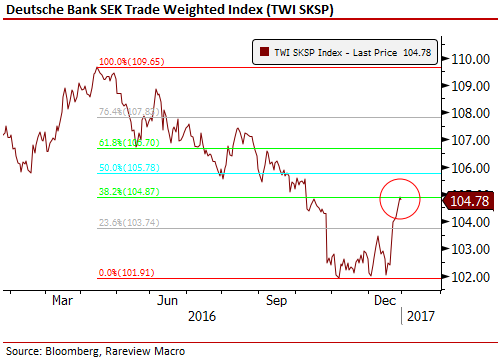
More importantly, at the meeting, three members dissented from any the further extraordinary policy, while a compromise was reached to slow the pace of monthly asset purchases. While not a consensus view just yet there is an argument that
To view this content you must be an active member of the TAN Association.
Not a member? Join the TAN Association and unlock access to hundreds of hours of written and video technical analysis content, including the Journal of Technical Analysis and the Video Archives. Learn more about Membership here.
Contributor(s)

Neil Azous
Neil Azous is the Founder and Managing Member of Rareview Macro, a Stamford, CT-based independent research. Neil is also the Editor-in-Chief of Sight Beyond Sight®, a daily financial publication focused on global macro investing. Neil has two decades of...
RELATIONSHIP INVESTING: STOCK MARKET THERAPY FOR YOUR MONEY BY JEFFREY WEISS, CMT
In Relationship Investing: Stock Market Therapy for Your Money, Jeffrey S. Weiss, CMT, takes a nontechnical look at technical analysis. He explains the stock market in terms usually used to understand personal relationships. This is done to make the market understandable to anyone. Technical analysts will recognize all of the important principles about their discipline, but analysts less familiar with the field will gain insights that may have been difficult to grasp in the past.
Jeff learned the value of technical analysis in his youth, when a broker presented him with a choice of either fundamental or technical market analysis. He offered Jeff a stack of thick annual reports, or a far thinner chart book containing several hundred names. Fearing hernia surgery if he attempted to carry home all those annual reports, he
To view this content you must be an active member of the TAN Association.
Not a member? Join the TAN Association and unlock access to hundreds of hours of written and video technical analysis content, including the Journal of Technical Analysis and the Video Archives. Learn more about Membership here.
Contributor(s)
Michael Carr, CMT
Mike Carr, who holds a Chartered Market Technician (CMT) designation, is a full-time trader and contributing editor for Banyan Hill Publishing, a leading investment newsletter service. He is an instructor at the New York Institute of Finance and a contributor to various...
DO STOCKS OUTPERFORM TREASURY BILLS?
Editor’s note: This is a brief extract of a research paper that can be downloaded from SSRN.com.
Abstract: Most common stocks do not outperform Treasury Bills. Fifty eight percent of common stocks have holding period returns less than those on one-month Treasuries over their full lifetimes on CRSP. When stated in terms of lifetime dollar wealth creation, the entire gain in the U.S. stock market since 1926 is attributable to the best-performing four percent of listed stocks. These results highlight the important role of positive skewness in the cross-sectional distribution of stock returns. The skewness in long-horizon returns reflects both that monthly returns are positively skewed and the fact that compounding returns over multiple periods itself induces positive skewness. The results also help to explain why active strategies, which tend to be poorly diversified, most often underperform.
I. Introduction
The question posed in the title of this paper may seem nonsensical. The
To view this content you must be an active member of the TAN Association.
Not a member? Join the TAN Association and unlock access to hundreds of hours of written and video technical analysis content, including the Journal of Technical Analysis and the Video Archives. Learn more about Membership here.
Contributor(s)
Hendrik Bessembinder
New Educational Content This Month
-
August 26, 2020

The CMT Experience
Presenter(s): Tyler Wood, Dave Lundgren, CMT, CFA
-
August 26, 2020
Reading the Current Market in Light of History’s Lessons
Presenter(s): Ryan Detrick, CMT
-
August 12, 2020
How to Spot Major Trend Reversals with Elliott Waves and Socionomics: Examples from Asia’s Ongoing Secular Bull Market
Presenter(s): Mark Galasiewski