
LETTER FROM THE EDITOR
This month, we are highlighting several examples of work that may be at the leading edge of technical analysis research. Robert Prechter, Jr., CMT, popularized Elliott Wave and is probably the individual most responsible for its worldwide popularity. He has continued studying wave patterns and extended that study to socionomics, a field he developed and discusses in this issue.
In addition to demonstrating his personal brilliance, socionomics demonstrates how the knowledge gained in the study of technical analysis can be applied to other fields. A detailed example of socionomics, demonstrating the link between the public mood, stocks prices and Presidential elections, is also included and readers should consider downloading the full paper. Manuel Amunategui then offers an intriguing idea that addresses some of the problems created by 24-hour trading. In some markets, the open and close have become less significant but the technique Manuel presents could help redefine price charts in these markets.
December marks the end of the year and an end to a special discount price available for the Annual
To view this content you must be an active member of the TAN Association.
Not a member? Join the TAN Association and unlock access to hundreds of hours of written and video technical analysis content, including the Journal of Technical Analysis and the Video Archives. Learn more about Membership here.
What's Inside...
SOCIAL MOOD, STOCK MARKET PERFORMANCE, & US PRESIDENTIAL REELECTIONS
Many readers of Technically Speaking know that former MTA president Robert Prechter, Jr. has pioneered the field of socionomics, which according to the Socionomics Institute is “the study of social...
AN INTERVIEW WITH ROBERT R. PRECHTER JR.: WHERE I BELIEVE SOCIONOMICS IS HEADING
by Robert PrechterSocionomics Institute Director Mark Almand interviews MTA member and founder of the Socionomics Institute, Robert Prechter, Jr. Mark Almand: Socionomics seems to be gathering steam. You have a...
INTERVIEW WITH KATIE STOCKTON, CMT
by Katie Stockton, CMT & Amber Hestla-BarnhartHow would you describe your job? My job is to provide technical research to institutional clients, including mutual funds and hedge funds. My focus is primarily on U.S. equities, although...
THE THREE-BAR TRADING DAY
by Manuel AmunateguiThe Three-Bar Trading Day is a quick way to gauge market participation by separating the trading day into three parts: the pre-market, the regular session, and the post-market. This isn’t...
MTA BLOGS
by Bhaskar Radadiya & Brennan BasnickiEditor’s note: The blogs on the members’ section of the MTA web site are a valuable source of short-term trading ideas as the first reprint below demonstrates. They are also a resource for those...
SOCIAL MOOD, STOCK MARKET PERFORMANCE, & US PRESIDENTIAL REELECTIONS
Many readers of Technically Speaking know that former MTA president Robert Prechter, Jr. has pioneered the field of socionomics, which according to the Socionomics Institute is “the study of social mood and its consequences in social action.”
A paper by Prechter and co-authors Deepak Goel (Socionomics Institute), Wayne Parker (Emory University, inactive status) and Matt Lampert (University of Cambridge) titled “Social Mood, Stock Market Performance and U.S. Presidential Reelections—A Socionomic Perspective on Voting Results” was published in November in the peer-reviewed journal, SAGE Open. The study covers every U.S. presidential election bid back to George Washington’s successful campaign in 1792.
The paper shows that the U.S. stock market is a statistically valid predictor of U.S. presidential re-election outcomes, whereas GDP, the inflation rate and the unemployment rate are not. The results are consistent with socionomic voting theory, which includes the hypotheses that (1) social mood as reflected by the stock market is
To view this content you must be an active member of the TAN Association.
Not a member? Join the TAN Association and unlock access to hundreds of hours of written and video technical analysis content, including the Journal of Technical Analysis and the Video Archives. Learn more about Membership here.
AN INTERVIEW WITH ROBERT R. PRECHTER JR.: WHERE I BELIEVE SOCIONOMICS IS HEADING
Socionomics Institute Director Mark Almand interviews MTA member and founder of the Socionomics Institute, Robert Prechter, Jr.
Mark Almand: Socionomics seems to be gathering steam. You have a monthly publication called The Socionomist. In addition to the two you wrote, three books about socionomics have now been written by others and published, including Peter Atwater’s “Mood and Markets” this year. Five academic papers are now in print, your annual socionomics summit is on its third year, you and others have presented socionomics at the world’s most prestigious universities, and a handful of professors have taught socionomics classes. Even the media is getting aboard with coverage of your recent Elections study. You must be pleased.
R.P.: I always feel that it’s taking too long for people to discover socionomics. But when I review the latest developments, I realize that progress is coming along nicely. So thanks for the reminder.
For the benefit of new
To view this content you must be an active member of the TAN Association.
Not a member? Join the TAN Association and unlock access to hundreds of hours of written and video technical analysis content, including the Journal of Technical Analysis and the Video Archives. Learn more about Membership here.
Contributor(s)

Robert Prechter
Robert Prechter has written 14 books on finance, beginning with Elliott Wave Principle in 1978, which predicted a 1920s-style stock market boom. His 2002 title, Conquer the Crash, predicted the 2007 crisis. Prechter’s latest interest is a new approach to social science, which...
INTERVIEW WITH KATIE STOCKTON, CMT
How would you describe your job?
My job is to provide technical research to institutional clients, including mutual funds and hedge funds. My focus is primarily on U.S. equities, although inter-market analysis is a big part of my discipline. I always have a stance on crude oil, gold, the U.S. dollar and the 10-year Treasury yield, among other things. Indicators are essential to my work because they allow me to take an objective approach to the market, which helps our clients manage risk and generate alpha. My typical day starts early with our morning firmwide call, followed by the creation of a pre-market report called Morning Technicals. The balance of my day is dedicated to client projects, preparing the next day’s research and keeping our trading desk abreast of important technical developments in a large universe of stocks, indices and ETFs. Of course, I am on the road from time to
To view this content you must be an active member of the TAN Association.
Not a member? Join the TAN Association and unlock access to hundreds of hours of written and video technical analysis content, including the Journal of Technical Analysis and the Video Archives. Learn more about Membership here.
Contributor(s)

Katie Stockton, CMT
Katie Stockton, CMT, is Founder and Managing Partner of Fairlead Strategies, LLC, an independent research provider focused on technical analysis. Prior to forming Fairlead Strategies, Katie spent more than 20 years on Wall Street providing technical research and advice to...
Amber Hestla-Barnhart
THE THREE-BAR TRADING DAY
The Three-Bar Trading Day is a quick way to gauge market participation by separating the trading day into three parts: the pre-market, the regular session, and the post-market. This isn’t revolutionary. Some financial charting packages and websites offer this as a canned option. But those that aren’t familiar with this way of looking at things may be missing out on part of the story.
By applying basic correlation analysis between bars, one can learn a lot about a particular market’s behavior. Even a brief glance at the pre-market can offer an educated guess at the coming market volatility. It also adds that many more bars for classic candlestick pattern interpretation. This should enrich any trading system that may benefit from an advanced peek at the interest level and participation in a particular market.
Below is a snippet of market data seen from a run-of-the-mill candlestick chart. Each candlestick bar represents the regular,
To view this content you must be an active member of the TAN Association.
Not a member? Join the TAN Association and unlock access to hundreds of hours of written and video technical analysis content, including the Journal of Technical Analysis and the Video Archives. Learn more about Membership here.
Contributor(s)

Manuel Amunategui
Manuel Amunategui has worked on Wall Street in the options industry for over six years. He now lives in Portland, Oregon and spends most of his time in the data and data-mining industry but still finds time to experiment and run trading systems. He can be reached at...
MTA BLOGS
Editor’s note: The blogs on the members’ section of the MTA web site are a valuable source of short-term trading ideas as the first reprint below demonstrates. They are also a resource for those managing portfolios with examples of how to apply technical analysis beyond price charts as the second example reprinted below highlights.
Spot Gold: Looking for $1768 on a Pattern Breakout by Bhaskar Radadiya
The price of spot gold has been trading based on the effects of an inverse Head & Shoulders (H&S) formation since reaching the last pullback level of $1735, a price that was also equal to 78.6% of the previous wave. A clear picture of the pattern can be seen on the 1-hour chart which highlights the $1768 target and expected resistance.
Chart of 1-hour price data
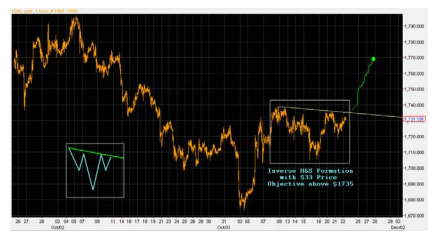
We can see
To view this content you must be an active member of the TAN Association.
Not a member? Join the TAN Association and unlock access to hundreds of hours of written and video technical analysis content, including the Journal of Technical Analysis and the Video Archives. Learn more about Membership here.
Contributor(s)

Bhaskar Radadiya
Bhaskar Radadiya is the head of technical research at ANS Pvt Ltd in India. He has held this position since April 2008. Prior to that, Bhaskar worked as an advisor with ANS Pvt Ltd and several other firms. He completed an MBA in finance at the V. M. Patel Institute of...

Brennan Basnicki
Brennan Basnicki is an independent trader/analyst. He has completed an MSc in Investment Analysis with Distinction at University of Stirling in the United Kingdom. Prior to that, he worked as a proprietary trader with several firms in Canada. He can be reached at...
New Educational Content This Month
-
August 26, 2020

The CMT Experience
Presenter(s): Tyler Wood, Dave Lundgren, CMT, CFA
-
August 26, 2020
Reading the Current Market in Light of History’s Lessons
Presenter(s): Ryan Detrick, CMT
-
August 12, 2020
How to Spot Major Trend Reversals with Elliott Waves and Socionomics: Examples from Asia’s Ongoing Secular Bull Market
Presenter(s): Mark Galasiewski