
 LETTER FROM THE EDITOR
We take an extended look at the trading philosophy of Ian Woodward in this month’s issue. Ian has created a complete investment methodology based on the work of William O’Neil, Richard Arms and John Bollinger and the articles we feature offer an example of the thought process required for successful market analysis. The format is different than seen in most issues of this newsletter because it is a mix of figures and explanatory text that develop the ideas logically.
Ian came to my attention after John Bollinger, CFA, CMT, mentioned his work. John met with Ian as a result of an MTAEF luncheon fundraiser. John found that Ian’s work inspired him and will result in a new suite of indicators from this market master. Based on that fact, I set out to find Ian and learned he was a second-career technician, devoting his efforts to the market after retiring as an engineer. His story seemed similar to that which the late Art Merrill, CMT, might have shared. Art retired as an
To view this content you must be an active member of the TAN Association.
Not a member? Join the TAN Association and unlock access to hundreds of hours of written and video technical analysis content, including the Journal of Technical Analysis and the Video Archives. Learn more about Membership here.
What's Inside...
ANOTHER STRENGTH INDICATOR
by Manuel AmunateguiThis powerful and easily overlooked indicator is based on a simple candlestick price action pattern. It extracts and isolates raw market strength by measuring the unchallenged portion from one bar to...
IAN WOODWARD: AN UNDERFOLLOWED ANALYST
Editor’s note: Much of this article uses slides and explanations provided by Ian. The purpose of this article is to highlight his work, which is comprehensive and built from the ground up based on...
HGSI GLOSSARY OF TERMS
by Ian WoodwardEditor’s Note: Ian Woodward has developed a comprehensive and unique way of looking at the markets. This article highlights several of the indicators and insights he has developed. It is a glossary...
PUMP & DUMP, SLOP & CROP, SEE-SAW … WHATEVER!
by Ian WoodwardEditor’s note: This is an example of a market opinion from Ian Woodward, an innovative market analyst. It originally appeared at his blog (http://go.mta.org/544) on July 31, 2012 and is reposted...
INTERVIEW WITH GEORGE DAVIS, CMT
by George Davis, CMT & Amber Hestla-BarnhartHow would you describe your job? In my current role, I am responsible for technical analysis research pertaining to the fixed income and currency asset classes. It’s a challenging and interesting...
TREND FOLLOWING IS JUST EASY TO DO
by Greg Schnell, CMT, MFTAEditor’s Note: This was originally posted at The Canadian Technician blog on stockcharts.com. It was posted on July 27, 2012 and is included here as an example of how analysis can be insightful,...
53’ OF BEAR CANARY. DON’T OPEN THE DOOR!
by Greg Schnell, CMT, MFTAThis article was originally posted at The Canadian Technician blog (http://go.mta.org/540) and is reprinted here with permission of the author. FEDEX – I heard this morning that Fedex is not...
MTAEF AWARDS 1ST CMT SCHOLARSHIP
The MTA Educational Foundation (MTAEF) is pleased to announce the award of its first CMT Scholarship to Adam Gray Lacey, a Senior in Economics at The Pennsylvania State University (PSU) Smeal College...
ANOTHER STRENGTH INDICATOR
This powerful and easily overlooked indicator is based on a simple candlestick price action pattern. It extracts and isolates raw market strength by measuring the unchallenged portion from one bar to the next. As it does not need smoothing, this indicator is as fast as the chart it is derived from.
The value is found by calculating the unchallenged zone between the previous open and the current bar. This zone is indicative of strength because either one side was too strong or the other too weak and the result yields a measurement of directional momentum.
 The colored rectangles represent unchallenged zones. The blue zone is a show of bullish strength and the red one, of bearish strength.
This is an important conjecture as the market is sending an irrevocable message of who is in
To view this content you must be an active member of the TAN Association.
Not a member? Join the TAN Association and unlock access to hundreds of hours of written and video technical analysis content, including the Journal of Technical Analysis and the Video Archives. Learn more about Membership here.
Contributor(s)

Manuel Amunategui
Manuel Amunategui has worked on Wall Street in the options industry for over six years. He now lives in Portland, Oregon and spends most of his time in the data and data-mining industry but still finds time to experiment and run trading systems. He can be reached at...
IAN WOODWARD: AN UNDERFOLLOWED ANALYST
Editor’s note: Much of this article uses slides and explanations provided by Ian. The purpose of this article is to highlight his work, which is comprehensive and built from the ground up based on a series of unifying principles. While this article is lengthy, much of it is graphics and is easily understood. Someone interested in learning how to develop a comprehensive philosophy will find Ian’s work and details on how he developed his analytical framework to be worth considering as a model as to how they can develop their own style.

Ian Woodward is well known in the trading community, but his work has still not achieved the wide acclaim it should have. For more than 18 years, he has made presentations and published commentary about high growth stocks with his own special style that combines logic, wit, and practical experience. Ian
To view this content you must be an active member of the TAN Association.
Not a member? Join the TAN Association and unlock access to hundreds of hours of written and video technical analysis content, including the Journal of Technical Analysis and the Video Archives. Learn more about Membership here.
HGSI GLOSSARY OF TERMS
Editor’s Note: Ian Woodward has developed a comprehensive and unique way of looking at the markets. This article highlights several of the indicators and insights he has developed. It is a glossary because the terms are his creation, however each of his ideas is testable on any platform and many traders will find these ideas to be invaluable. This glossary originally appeared on Ian’s blog (http://go.mta.org/546), supplemented with material provided by Ian, and is reprinted here with permission.
I am reminded by Tim, a friend and supporter of the HGSI Software who gave me good and encouraging advice in his feedback to my previous blog note of terms Ron and I use from time to time that new readers may come across which are unfamiliar to the casual reader. This Blog Note is to help such readers with a brief description of some of the terms I use from time to
To view this content you must be an active member of the TAN Association.
Not a member? Join the TAN Association and unlock access to hundreds of hours of written and video technical analysis content, including the Journal of Technical Analysis and the Video Archives. Learn more about Membership here.
Contributor(s)

Ian Woodward
BIO
PUMP & DUMP, SLOP & CROP, SEE-SAW … WHATEVER!
Editor’s note: This is an example of a market opinion from Ian Woodward, an innovative market analyst. It originally appeared at his blog (http://go.mta.org/544) on July 31, 2012 and is reposted here with permission.
Can you believe the two-day turn up for the books on Thursday and Friday of last week to raise the hopes of the Bulls that there is enough momentum to lift this Stock Market out of the doldrums. Make no mistake about it this was a strong rebound as I will demonstrate in the ensuing charts. However, we are still suffering from a chop-chop market:

Prior to the last two days we were in danger of heading down to break the 50-dma on all the Market Indexes, and although we have two Indexes with Death Crosses where the 50-dma comes down
To view this content you must be an active member of the TAN Association.
Not a member? Join the TAN Association and unlock access to hundreds of hours of written and video technical analysis content, including the Journal of Technical Analysis and the Video Archives. Learn more about Membership here.
Contributor(s)
Ian Woodward
BIO
INTERVIEW WITH GEORGE DAVIS, CMT
How would you describe your job?
In my current role, I am responsible for technical analysis research pertaining to the fixed income and currency asset classes. It’s a challenging and interesting role, as it involves not only producing technical research related to these asset classes, but also marketing the research to our global staff and client base. I am a big proponent of educating salespeople, traders and clients alike about how they can use technical analysis effectively in their respective roles – whether it is for a trade idea or a potential hedge in order to manage risk exposure.
I rely heavily on intermarket analysis in this regard, as it provides a cross asset view of the financial world that can be invaluable in today’s uncertain investment climate. This broadens the appeal of the research product as well in that it becomes relevant to a number of different portfolio and risk managers
To view this content you must be an active member of the TAN Association.
Not a member? Join the TAN Association and unlock access to hundreds of hours of written and video technical analysis content, including the Journal of Technical Analysis and the Video Archives. Learn more about Membership here.
Contributor(s)

George Davis, CMT
George Davis, CMT is Managing Director and Chief Technical Strategist, Fixed Income, Currencies and Commodities at RBC Capital Markets in Toronto, Canada. With over 25 years of market experience, he is responsible for RBC’s Canadian dollar forecasts as well as intermarket...
Amber Hestla-Barnhart
TREND FOLLOWING IS JUST EASY TO DO
Editor’s Note: This was originally posted at The Canadian Technician blog on stockcharts.com. It was posted on July 27, 2012 and is included here as an example of how analysis can be insightful, meaningful, and short. It is reprinted here with the permission of the author. A more detailed example of Greg’s work follows this article.
Well, another day another trend. As long as you use a 10 minute chart!
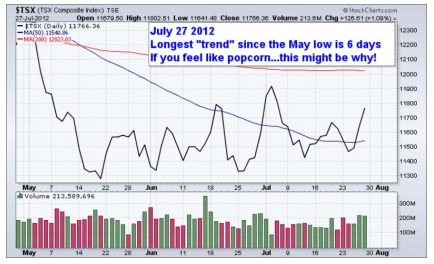
The longest trend from low to high has been 6 days. Oil stocks are starting to get a bid. The gold breakout this week couldn’t be more timid.
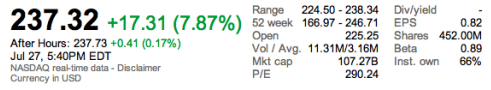
Friday’s bizarro world. It is an amazing time to be an investor. Amazon misses with a P/E of 290 and the stock goes up.
To view this content you must be an active member of the TAN Association.
Not a member? Join the TAN Association and unlock access to hundreds of hours of written and video technical analysis content, including the Journal of Technical Analysis and the Video Archives. Learn more about Membership here.
Contributor(s)

Greg Schnell, CMT, MFTA
Greg A. Schnell, CMT, MFTA is a Senior Technical Analyst at StockCharts.com, specializing in intermarket and commodities analysis. Greg joined StockCharts in 2012 and has been instrumental in helping launch a variety of new blogs and other commentary platforms. Based in Calgary,...
53’ OF BEAR CANARY. DON’T OPEN THE DOOR!
This article was originally posted at The Canadian Technician blog (http://go.mta.org/540) and is reprinted here with permission of the author.
FEDEX – I heard this morning that Fedex is not like UPS at all. It is only UPS that has a problem. Let’s check the charts. Here is FEDEX weekly from 2005.
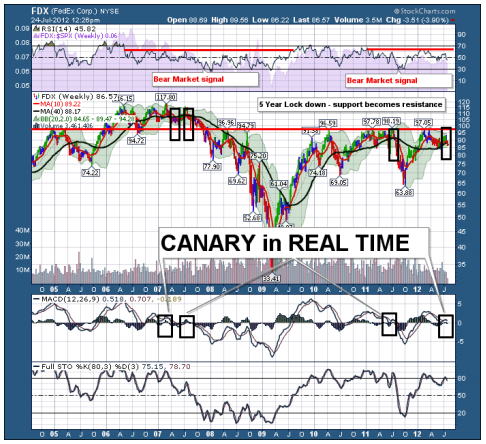
Well. Is it a canary, A black bear, a Grizzly or a Kodiak?
Notice the RSI (“Relative Strength Index”) has given us a bear market signal. A bear market signal is when the RSI falls to 30. On the following rally, the stock has trouble pushing the RSI above 60-65. Bear market signals on an RSI are pretty reliable, but they never tell us when the following top will come in.
Well, we got our bear market signal in 2011, and here we
To view this content you must be an active member of the TAN Association.
Not a member? Join the TAN Association and unlock access to hundreds of hours of written and video technical analysis content, including the Journal of Technical Analysis and the Video Archives. Learn more about Membership here.
Contributor(s)
Greg Schnell, CMT, MFTA
Greg A. Schnell, CMT, MFTA is a Senior Technical Analyst at StockCharts.com, specializing in intermarket and commodities analysis. Greg joined StockCharts in 2012 and has been instrumental in helping launch a variety of new blogs and other commentary platforms. Based in Calgary,...
MTAEF AWARDS 1ST CMT SCHOLARSHIP
 The MTA Educational Foundation (MTAEF) is pleased to announce the award of its first CMT Scholarship to Adam Gray Lacey, a Senior in Economics at The Pennsylvania State University (PSU) Smeal College of Business. Adam is a member of PSU’s Trading Club, which educates its members on various technical analysis methods. He was drawn to the club while seeking a systematic way to gauge and measure market flow.
Adam participated in PSU Trading Club’s Spring 2012 trading competition, winning with a portfolio return of 22% for the period. He was awarded the $500 scholarship and will be taking the October 2012 Level 1 exam. Adam graduates in December 2012 and plans on continuing with a Master’s degree in Finance. A favorite book of his is “Trading in the Zone” by Mark Douglas.
The MTAEF is a 501(c)(3) non-profit organization that supports technical analysis educational
To view this content you must be an active member of the TAN Association.
Not a member? Join the TAN Association and unlock access to hundreds of hours of written and video technical analysis content, including the Journal of Technical Analysis and the Video Archives. Learn more about Membership here.
New Educational Content This Month
-
August 26, 2020

The CMT Experience
Presenter(s): Tyler Wood, Dave Lundgren, CMT, CFA
-
August 26, 2020
Reading the Current Market in Light of History’s Lessons
Presenter(s): Ryan Detrick, CMT
-
August 12, 2020
How to Spot Major Trend Reversals with Elliott Waves and Socionomics: Examples from Asia’s Ongoing Secular Bull Market
Presenter(s): Mark Galasiewski