 Letter from the Editor
This month’s issue demonstrates the rich variety that exists within the field of technical analysis.
- Todd Campbell presents quantitative analysis showing stock market behavior after VIX extremes. This is an example of using sentiment as an input into the trading process and demonstrates the value of sentiment when applied as part of a long-term analysis.
- Kenneth G. Winans, CFA, CMT recently published his second book, Investment Atlas – Financial Maps to Investment Success which documents investment returns using richly detailed charts to place market returns into historical context. If you ever wondered how real estate has performed in France or Japan over the past fifty years, this book is for you. Along with other esoteric asset classes, Investment Atlas also shows stock and bond returns in detail for various historical events which can help those who realize history tends to repeat.
- George Schade, Jr., CMT, is certainly one of those who understands the importance of studying history. He returns to the pages of Technically Speaking with a biography of R.
To view this content you must be an active member of the TAN Association.
Not a member? Join the TAN Association and unlock access to hundreds of hours of written and video technical analysis content, including the Journal of Technical Analysis and the Video Archives. Learn more about Membership here.
What's Inside...
VIX Profi ts
by Todd CampbellWe crunched the VIX numbers since 1990. Position traders beware; the success rate for a positive SPX 1-month after the first +30 reading is most risky. 13 of the 40 distinct periods of +30 VIX since...
Investment Atlas – Financial Maps to Investment Success by Kenneth G. Winans, CFA, CMT
by Ken Winans, CMT & Michael Carr, CMTTechnical analysts often look at charts of past price action to assess the current state of the financial markets. In this beautifully illustrated book, Winans has assembled a great deal of data to...
On the Campus: Technical Analysis on Campus at Rutgers University
by Lawrence LaterzaThe graduate level course in technical analysis at Rutgers University was originated in the early 1990’s by David Krell. He was followed by Bruce Kamich, who taught the course until 2003. Over the...
MTA Annual Award Recipient Profi le: Ralph Nelson Elliott
The Market Technicians Association’s (MTA’s) Award Committee seeks to honor the various Annual Award recipients with this profile series describing the individual’s life and work in technical...
Intermarket Cycles and the World in 2012
by Mukul PalEditor’s note: This has been adapted from previously published client research. Some figures have numbers embedded in the graphics which do not match the caption number. We apologize for the...
Technical Analysis Warned of Indian Equity Market Crash
by Ashish KyalS&P CNX Nifty is a well diversified 50 stock index accounting for 21 sectors of the economy. S&P CNX Nifty is owned and managed by India Index Services and Products Ltd. This year has seen...
VIX Profi ts
We crunched the VIX numbers since 1990. Position traders beware; the success rate for a positive SPX 1-month after the first +30 reading is most risky. 13 of the 40 distinct periods of +30 VIX since 1990 found the SPX down 30 days after the first 30 VIX day. Notably, of those 13, 11 began in Q3. Long term buyers take heart: the SPX was lower 12-months following the first +30 VIX reading only 6 times.
Since 1990, the volatility index has had 40 distinct periods with above 30 readings. Each time, investors who bought the S&P 500 on the first day the VIX crossed over 30 made money either 1-month, 3-months, 6-months or 12-months following. (See Table 1)
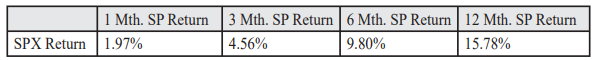 Table 1: The average return of the SPX from the 1st +30
To view this content you must be an active member of the TAN Association.
Not a member? Join the TAN Association and unlock access to hundreds of hours of written and video technical analysis content, including the Journal of Technical Analysis and the Video Archives. Learn more about Membership here.
Contributor(s)

Todd Campbell
Todd Campbell is President and Founder of E.B. Capital Markets, LLC. Todd has been providing independent equity research to professional money managers for more than a decade. In 2003, Todd founded E.B. Capital Markets, LLC, an independent research firm serving professional...
Investment Atlas – Financial Maps to Investment Success by Kenneth G. Winans, CFA, CMT
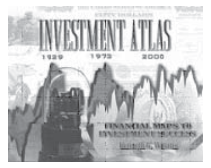 Technical analysts often look at charts of past price action to assess the current state of the financial markets. In this beautifully illustrated book, Winans has assembled a great deal of data to illustrate the history of stocks, bonds, commodities, and real estate markets around the world.
Winans asks, “Why did the majority of modern investors, the most knowledgeable and technologically advanced in history, mishandle the ‘Dot.com’ stock bull market and the recent ‘nothing down’ real estate frenzy?” His answer is that there is a general lack of knowledge about US financial history which results in investors making the same mistakes over and over.
To address this lack of knowledge, he has assembled hundreds of charts, many spanning more than 100 years and some more than 200 years, to put financial market history into perspective. Each chart is accompanied with narrative that places it
To view this content you must be an active member of the TAN Association.
Not a member? Join the TAN Association and unlock access to hundreds of hours of written and video technical analysis content, including the Journal of Technical Analysis and the Video Archives. Learn more about Membership here.
Contributor(s)

Ken Winans, CMT
Ken Winans, CMT President & Founder, Winans Investments For 28 years, Ken Winans, CMT, has conducted groundbreaking financial research within the discipline of technical analysis while serving as a portfolio manager, investment analyst, broker and investor. Ken is the...

Michael Carr, CMT
Mike Carr, who holds a Chartered Market Technician (CMT) designation, is a full-time trader and contributing editor for Banyan Hill Publishing, a leading investment newsletter service. He is an instructor at the New York Institute of Finance and a contributor to various...
On the Campus: Technical Analysis on Campus at Rutgers University
The graduate level course in technical analysis at Rutgers University was originated in the early 1990’s by David Krell. He was followed by Bruce Kamich, who taught the course until 2003. Over the years it was a pleasure to be a guest lecturer for the module on moving averages and to occasionally jump in as a substitute when Bruce encountered scheduling problems at Baruch College.
When career opportunity called, and Bruce was no longer able to continue the course at Rutgers, I was approached about taking it over. As excited as I was about the challenge of conducting my own course, I had to weigh a number of considerations before making my decision. My commodities brokerage career was typified by long hours and an inflexible schedule. The logistics of working a full day in downtown Manhattan and teaching at night in Newark, New Jersey were difficult. In addition, offering a course
To view this content you must be an active member of the TAN Association.
Not a member? Join the TAN Association and unlock access to hundreds of hours of written and video technical analysis content, including the Journal of Technical Analysis and the Video Archives. Learn more about Membership here.
Contributor(s)

Lawrence Laterza
MTA Annual Award Recipient Profi le: Ralph Nelson Elliott
 The Market Technicians Association’s (MTA’s) Award Committee seeks to honor the various Annual Award recipients with this profile series describing the individual’s life and work in technical analysis.
Ralph Nelson Elliott — 1996 Annual Lifetime Achievement Award
During the last 13 years of his life, Ralph Nelson Elliott advanced a unique theory of stock market action. The Elliott Wave Principle was first revealed privately, in December, 1934, to Charles J. Collins, an investment counselor.* Elliott describes his work as “a much needed complement to Dow Theory”, according to the letter which appears in Elliott Wave Principle: Key to Market Behavior by Frost and Prechter.1
Technical Analysis Background
Market participants were introduced to Elliott Wave Theory in August 1938, in the published monograph The Wave Principle, written by R.N. Elliott with Collins’ assistance. A year later,
To view this content you must be an active member of the TAN Association.
Not a member? Join the TAN Association and unlock access to hundreds of hours of written and video technical analysis content, including the Journal of Technical Analysis and the Video Archives. Learn more about Membership here.
Intermarket Cycles and the World in 2012
Editor’s note: This has been adapted from previously published client research. Some figures have numbers embedded in the graphics which do not match the caption number. We apologize for the confusion.
Intermarket cycles can change the way we look at asset cycles. This article, starting from 30 year mirroring of commodity and equity cycles, inflation and deflation cycles, this article also redefines Sam Stovall’s sector rotation structure giving new insights about the world order ahead.
It was not just investment gurus, but philosophers and painters who talked about simplicity being solved complexity and a very powerful investment approach. We also saw a Nobel Prize awarded to a simple thought that there is no economics without psychology. Sentiment comes before rationality and human beings are nice and dumb, not profit maximizing smart souls. Crowds are accordingly involved primarily with instincts, biological drives, compulsive behavior and emotions. Hence market success is less about economics
To view this content you must be an active member of the TAN Association.
Not a member? Join the TAN Association and unlock access to hundreds of hours of written and video technical analysis content, including the Journal of Technical Analysis and the Video Archives. Learn more about Membership here.
Contributor(s)

Mukul Pal
Mukul Pal, a technical analyst who holds the Chartered Market Technician (CMT) designation, is the founder of AlphaBlock, a technology group focused on bringing the predictive mapping characteristics of AI to the market mechanisms that use blockchain to create an adaptive...
Technical Analysis Warned of Indian Equity Market Crash
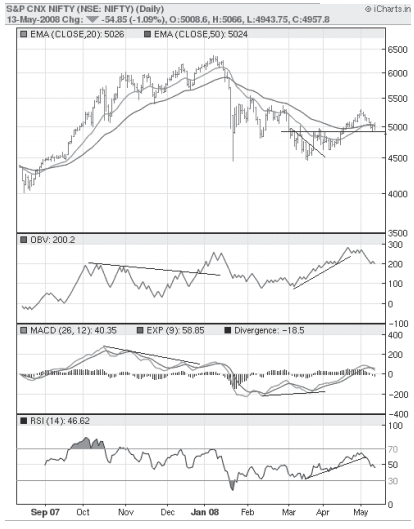 S&P CNX Nifty is a well diversified 50 stock index accounting for 21 sectors of the economy. S&P CNX Nifty is owned and managed by India Index Services and Products Ltd.
This year has seen turbulence in equity markets worldwide. NSE Nifty, representing the Indian equity market was no different. The period shown below represents times when sentiment moved from extreme optimism to extreme pessimism in a very short time. The fall in the Nifty of more than 21% in only 5 trading days was one of the effects of extreme greed as the market was reaching new highs even as global scenarios were weakening. The magnitude of the fall may not have been easily predictable, but indicators did give signals of weakness when a new top was being formed in mid-January.
From
To view this content you must be an active member of the TAN Association.
Not a member? Join the TAN Association and unlock access to hundreds of hours of written and video technical analysis content, including the Journal of Technical Analysis and the Video Archives. Learn more about Membership here.
Contributor(s)

Ashish Kyal
Ashish Kyal, who holds a Chartered Market Technician (CMT) designation, is the Director and Founder of Waves Strategy Advisors Pvt. Ltd. He has over ten years of experience doing technical analysis in capital markets; prior to starting his firm, Ashish worked in the capital...
New Educational Content This Month
-
August 26, 2020

The CMT Experience
Presenter(s): Tyler Wood, Dave Lundgren, CMT, CFA
-
August 26, 2020
Reading the Current Market in Light of History’s Lessons
Presenter(s): Ryan Detrick, CMT
-
August 12, 2020
How to Spot Major Trend Reversals with Elliott Waves and Socionomics: Examples from Asia’s Ongoing Secular Bull Market
Presenter(s): Mark Galasiewski